I’ve posted a couple times about the prospects of using high-resolution computed tomography imaging to assess cellular-level processes of growth and development. Today, Paul Tafforeau and colleagues present a synchrotron-based visualization of the adventurous paths that individual enamel-forming cells'(ameloblasts) take to form tooth crowns. I’ve been focusing more on using these techniques for studying bone growth, but I got the idea of that from previous studies of teeth (see Macchiarelli et al. 2006 and Smith et al. 2010).
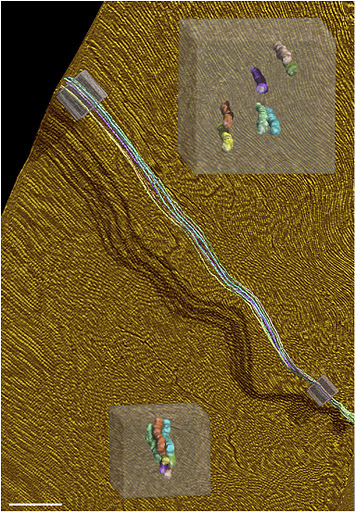 |
| Tafforeau et al 2012, Fig 3. Scale bar = 0.25 mm |
Time was, the internal microstructure and growth of enamel could only be examined using sectioned (either cut or naturally fractured) tooth crowns. Synchrotron imaging of teeth allowed Tafforeau and colleagues to get at this internal information in complete teeth whose insides are unexposed.
To the left is a “virtual” section of a molar tooth, the ‘base’ of the enamel (at the enamal-dentine junction) is at the bottom right, and the external surface of the tooth is at the top left. The lines radiating from the EDJ to the crown surface are enamel prisms, the mineralized paths of cells called “ameloblasts” that form tooth crowns. This is the cellular process by enamel is deposited to form a rock-hard tooth.
Note that the prisms start off packed closely together as they start their journey from the EDJ, but slowly diverge along roughly-parallel paths to be a bit further apart from one another (cross-sections in the cubes). The prisms’ shadow on projected onto the exposed crown shows how non-linearly ameloblasts course to their final destination in some dimensions – I for one don’t know why the path contains these kinks.
As with any awesome method, there are nevertheless limitations. Tafforeau and team say that enamel closer to the inside of the tooth is somewhat muddled, due to differences in the extent to which prisms had mineralized. And I don’t know any numbers, but I’d guess that scanning a lot of teeth would get pretty expensive. But ultimately is a pretty badass research tool. This fine-scale internal view of tooth microstructure can allow researchers to reconstruct how a tooth grew, and from there to examine the cellular growth processes involved in certain crown shapes, mechanical properties of teeth, and how enamel hypoplasias (markers of health stress) are created by affecting the behavior of cells. Very cool stuff.
![]() Those papers
Those papers
Macchiarelli, R., Bondioli, L., Debénath, A., Mazurier, A., Tournepiche, J., Birch, W., & Dean, M. (2006). How Neanderthal molar teeth grew Nature, 444 (7120), 748-751 DOI: 10.1038/nature05314
Smith, T., Tafforeau, P., Reid, D., Pouech, J., Lazzari, V., Zermeno, J., Guatelli-Steinberg, D., Olejniczak, A., Hoffman, A., Radovcic, J., Makaremi, M., Toussaint, M., Stringer, C., & Hublin, J. (2010). Dental evidence for ontogenetic differences between modern humans and Neanderthals Proceedings of the National Academy of Sciences, 107 (49), 20923-20928 DOI: 10.1073/pnas.1010906107
Tafforeau, P., Zermeno, J., & Smith, T. (2012). Tracking cellular-level enamel growth and structure in 4D with synchrotron imaging Journal of Human Evolution DOI: 10.1016/j.jhevol.2012.01.001