Gibbons are sometimes referred to as “lesser apes” since they’re the smaller-bodied cousins of “great apes” like us humans, chimpanzees, gorillas, and orangutans. But what they lack in body mass they make up for in taxonomic diversity, with roughly 20 species distributed across four genus groups (Kim et al., 2011). And while male great apes (except humans) have large canine teeth, both sexes in gibbons have large maxillary canines — flashy weaponry for defending territory.

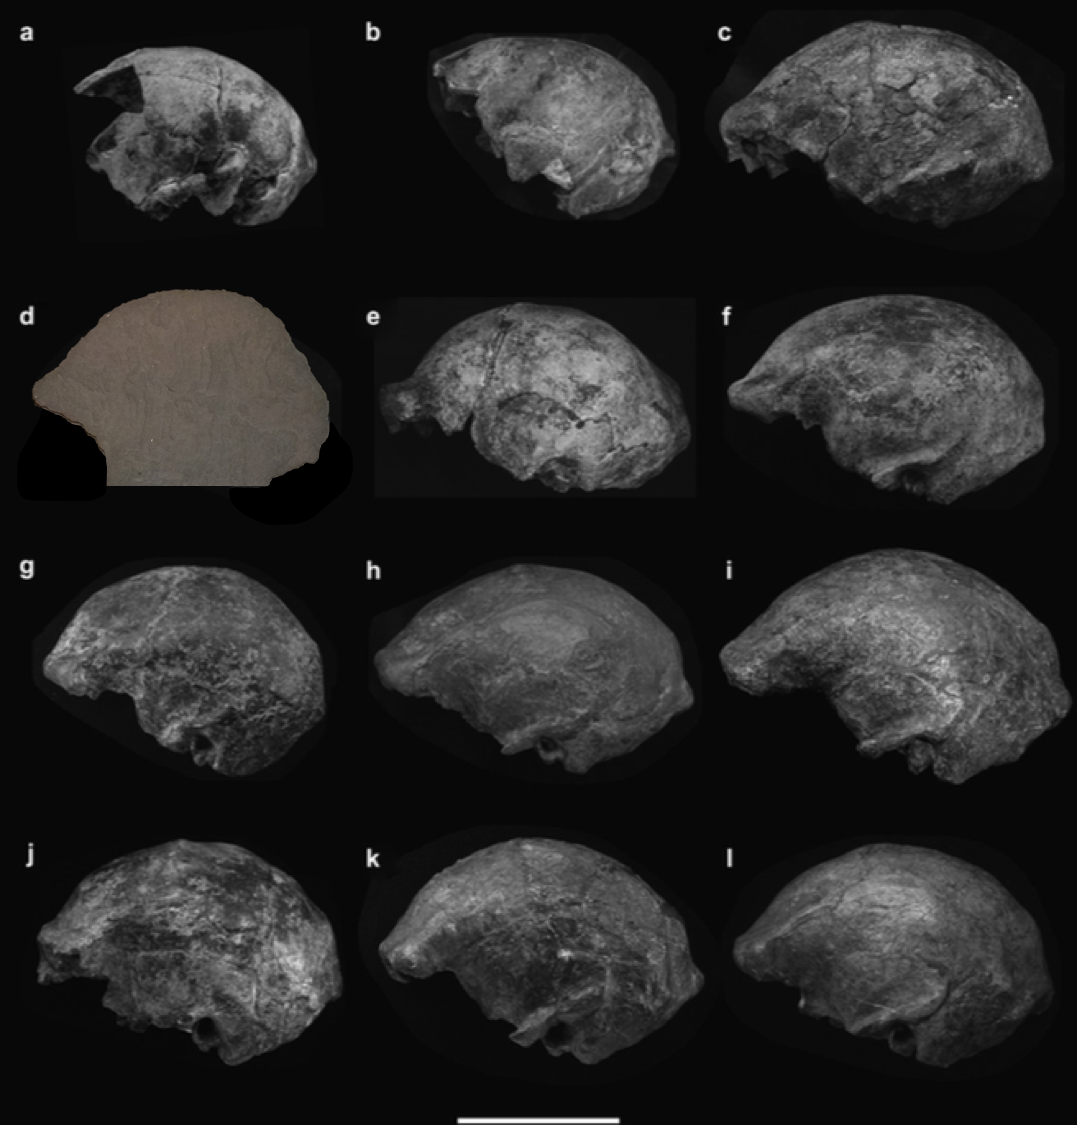
My research has generally focused on brains and growth throughout human evolution, but I started looking at gibbons a few years ago when the COVID-19 pandemic put research travel on hold. Inspired by Julia Zichello’s 2018 article about gibbon models for understanding hominin evolution and appreciating that “overlooked small apes need more attention,” I had the opportunity to CT scan a unique skeletal collection of white-handed gibbons (Hylobates lar), which was sadly harvested from the forests of Thailand back in the late 1930s. Previous research on skull growth in gibbons has mostly used small samples compiled from different species (and sometimes even different genera). In contrast, this CT dataset includes many individuals at each stage of maturation from late infancy through adulthood, effectively representing a single population at a point in time. So with this larger cross-sectional sample of a single species, we can better understand how gibbon brains and faces grow. And because permanent teeth form in a long, continuous sequence throughout the growth period, an individual’s state of dental development can serve as a marker of where they are along the maturation process.
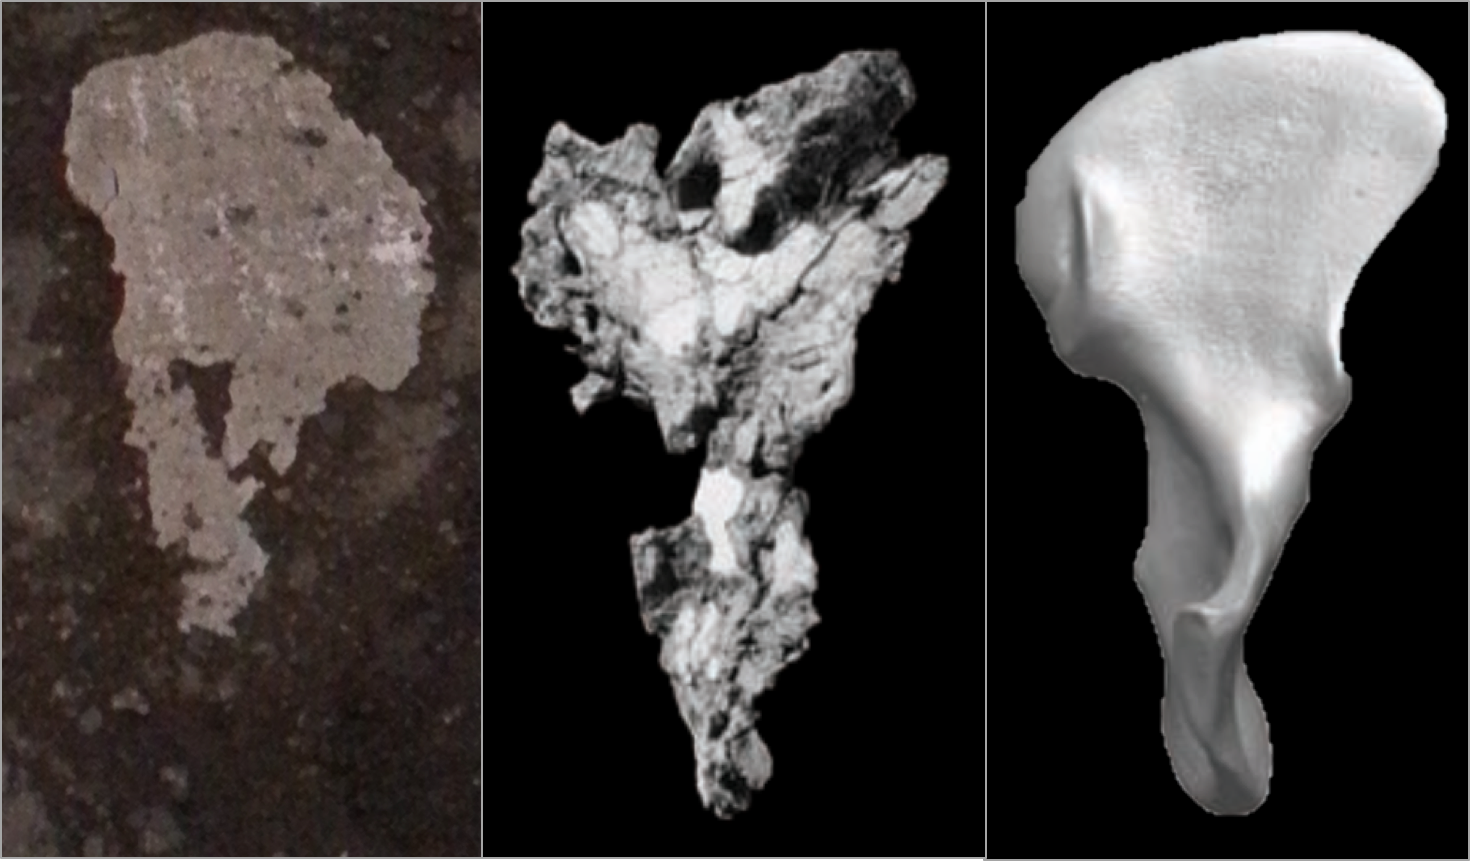
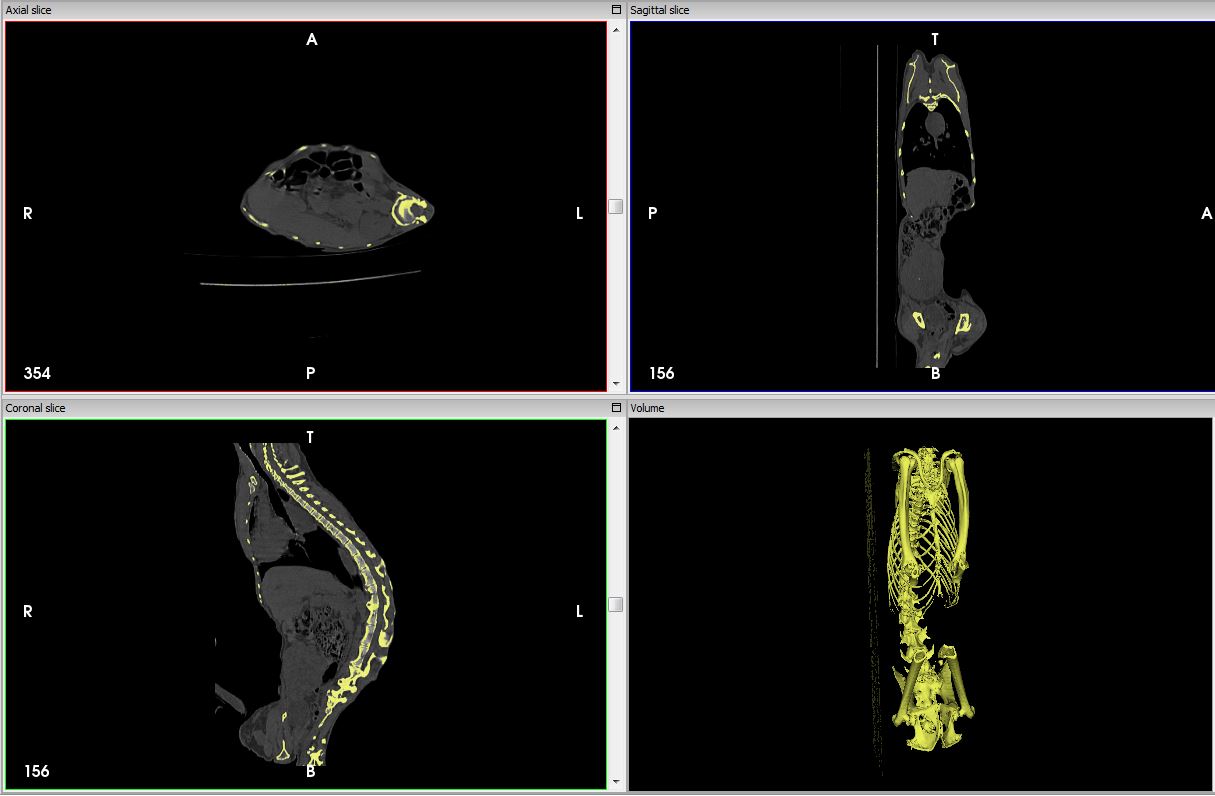
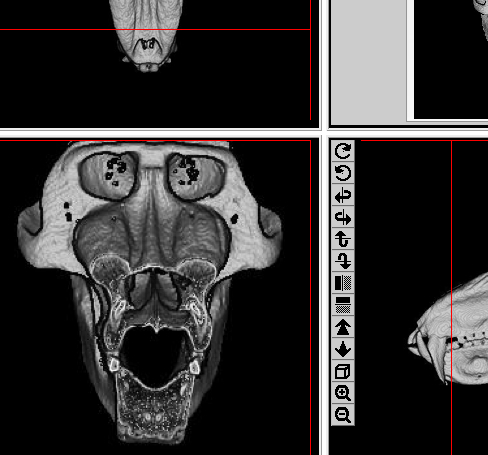
In a paper hot off the press, Julia Boughner and I analyzed dental development in this unique sample (article here). One of the coolest things we found was that gibbons’ large upper canine teeth are among the first to begin but last to finish tooth formation. In fact, the large canines growing inside relatively small faces may inhibit growth of one of the neighboring incisor teeth until the face has grown to create enough space for it. And while most teeth developing within the jaw begin emerging into the mouth once there’s enough room for them, gibbons’ gargantuan upper canines are forced out of hiding as they outgrow their bony crypts (check out the right-most jaw in the second row below).

In addition to characterizing ‘normal’ dental development, we also observed several developmental anomalies and pathologies in the sample. Our observations corroborate previous research showing that tooth formation generally proceeds ‘as scheduled’ despite various other disturbances to development.
It remains to be seen whether early development of the canine at the cost of delayed incisor formation is a pattern unique among all the apes, since most other studies of ape tooth formation have examined the lower jaw while our study focused on the upper jaws. But the canine-incisor tradeoff that we identified sets the stage for subsequent study of skull growth in this sample, as it highlights the many factors and functions that must be coordinated during growth.
While we have several projects planned with this unique dataset, we have also published the tooth formation data that we analyzed, and the original micro-CT scans themselves will be published to the online repository Morphosource.org soon, once a few more projects are finished.


