We’ve arrived at the Planet of the Apes, also known as the Miocene, in my “Bones, Stones and Genomes” course. The living apes are but a small remnant of what was a pretty successful radiation starting around 20 million years ago. There were so many apes that it can be a bit confusing for students, but it’s important for setting up the biological and ecological contexts of hominin origins.

Possible evolutionary relationships of myriad Miocene apes and subsequent hominins. From Harrison (2010)
This week also marks my students’ first lab assignment, analyzing CT scans of bones. Here, we looked at how we estimate body size in extinct animals, using the KUPRI database and the free CT analysis software InVesalius. Because some of the KUPRI primates have body masses recorded, students can examine the relationship between animals’ weight and skeletal dimensions. The purpose of the assignment is to help familiarize students with skeletal anatomy, CT data and principles of linear regression.

One of the KUPRI specimens, an old female gorilla, with known weight.
I selected a few specimens for students to examine. After students download the massive files, they can load them into InVesalius for analysis. This program allows students to easily identify bone versus other tissues, and to create a 3D surface rendering of a highlighted region (tissue) of interest.
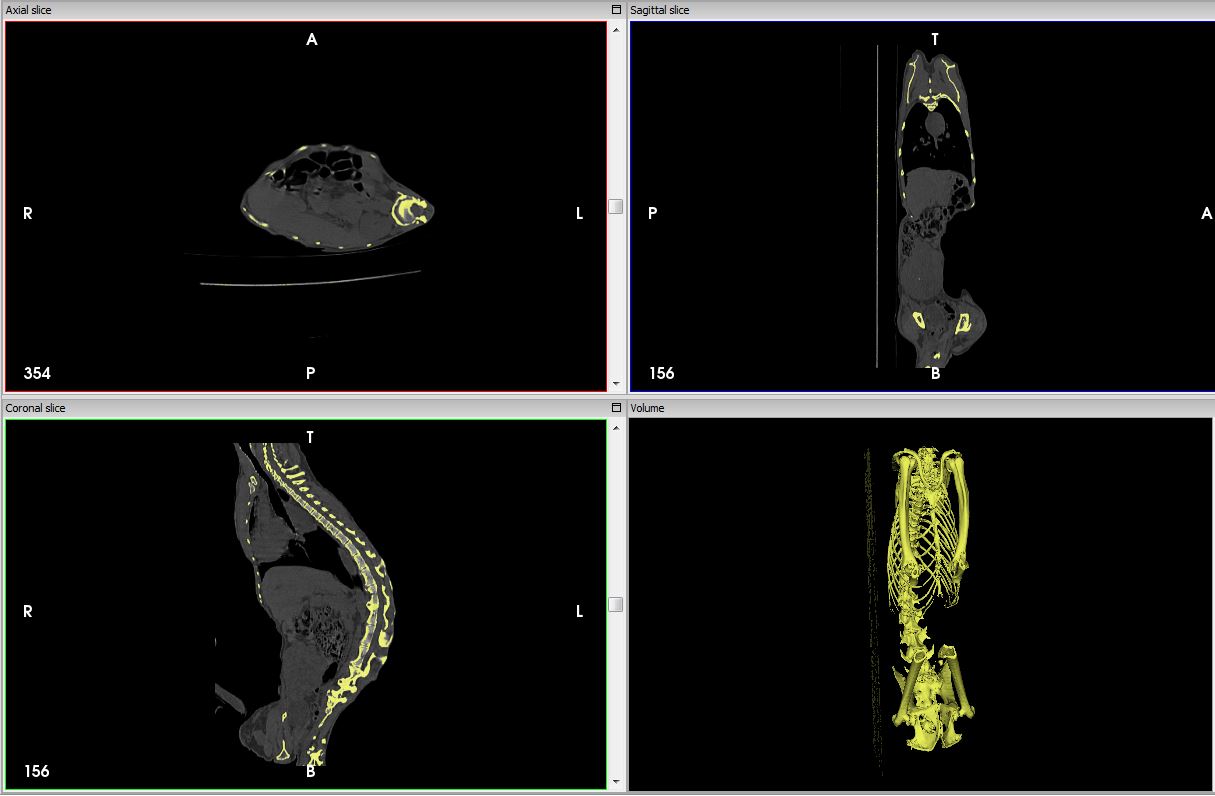
A grivet, Chlorocebus aethiops, with bone highlighted in 2D sections and as a 3D model. This little guy weighs only 4 kg!
It’s pretty easy to take simple linear measurements (and angles), assuming students can get oriented within the skeleton and identify the features they need to measure. It can be a little tricky to measure a femur head if it’s still in the acetabulum (below). Luckily, InVesalius lets you take measurements on both 2D slices or the 3D volume.

Let’s measure that femur head diameter.
So students do this for a few specimens and enter the data into Excel, which can then easily plot the data and provide a regression equation. They then use this equation to estimate masses of the specimens – if there’s a good relationship between mass and skeletal measures, then the estimates should be close to the observed values. Students use their equation to predict body mass of some Miocene apes based on femur head diameter and femur midshaft diameter, noting how confident they feel in their estimates given how well their regression performed on the training dataset. They also compare their mass estimates to those using another equation generated by Christopher Ruff (2003).
It might be a little intense for students totally unfamiliar with apes, bones and CT scans, but it should be a good way for them to learn lots of concepts we’ll revisit over the semester.
Here’s the lab assignment, in case you want to use it in your own class: Lab 1-Miocene masses
