New decade, new syllabi

We just kicked off the Spring semester here at Vassar College, and so I’ve got some freshly-updated bio-anthro syllabi hot off the press. This semester, I’m doing my annual introductory class (Anth 120, “Human Origins”), a resurrected seminar (Anth 305: “Human Evo-Devo”), and a second stab at a new methods module (Anth 211: “Virtual Anthropology”).

Anth 120 is similar to previous versions, although this year I’ve taken out a reading/lecture on Paleolithic technology, replaced with articles scrutinizing evolutionary psychology. We’ll see how it goes.

The other two classes are greatly overhauled from previous versions. Anth 211, “Virtual Anthropology,” is my first contribution to a new curricular initiative here at Vassar, which are called “intensives.” Anth 211 is kind of a hybrid between a regular class and an independent study, giving students experience with computer-based, “virtual” methods used in biological anthropology and related fields.  In the first half of the semester, students will get to try out some of these methods and see what kinds of research questions they’re used for. In the 2nd half of the term, students do their own Virtual Anthropology study drawing on the materials in my HEAD Lab, and then present a research poster at the end of the year. I debuted this intensive last Fall, and based on that experience I’m providing a bit more training and have more activities for students this Spring. If last semester’s projects are at all predictive, we should have some fun projects in store this year.

cropped-screen-shot-2020-01-19-at-1.30.37-pm.png

Anth 305 is a fossil-focused examination of the roles of growth and development in human evolution, and this year’s version is also highly modified from the last time I taught it over two years ago. In that first version, course content was patterned along the skeleton, e.g., one week looked at evolution and development of teeth, next week the spine, etc. Such a bauplan might work for building bodies, but it wasn’t the best for teaching. So this year, we’re spending the first few weeks on the fossil record of human evolution, getting acquainted with the curious characters of our deep past. From there, we go over skeletal / developmental biology, before delving into special evo-devo topics like “morphological integration” and “heterochrony” for the rest of the semester. We’ll also read lots of old, “classic” papers along the way.

Syllabi for these, and other classes, can be found on the teaching page of the site, if you want to learn more.

New anthropology syllabi for 2017

This Fall I’m teaching three courses at Vassar, two in Anthropology and one in Environmental Studies. Syllabi are posted to my Teaching page in case anyone wants to use them – here are the highlights:

Anth 235: Central Asian Prehistory

Anth 235 site map

I taught this for the first time last Spring, so the Fall syllabus is updated based on how things went in the first go around. This time, students will get more more in depth with the fossil hominins and less on the lithics on the early side. On the more recent end, there are now readings expressly concerned with sites of the Bactrian-Margiana Archaeological Complex, as well as archaeology of both the Tarim and Pazyryk mummies.

Anth 305: Human Evolutionary Developmental Biology

cropped-zevodevo1.jpg

This is a seminar version of the first class I ever made on my own, previously taught at the University of Michigan and Nazarbayev University. There have been lots of new discoveries and I’ve published more on this topic since the last time I taught the class. I’m  also excited to see how this class goes as a seminar in which students contribute more to discussion, rather than me rambling on about osteoblasts, morphological integration, and the like.

Enst 187: A Prehistoric Perspective on Climate Change

climatesummit

This is a 100% brand spankin new class, that uses the climate-denialist argument, “But climate has always been changing,” as a basis for comparing the past and the present. In this First-year Writing Seminar, we’ll compare arguments for defining the “Anthropocene,” examine how climate change may have impacted human evolution, and study archaeological evidence for how climate change has impacted different prehistoric societies.

Scientific Racism

The site’s been quiet in 2017, with little time to blog on top of my regular professional responsibilities, and of course watching the fascist smoke rising from the garbage fire of our 45th presidential administration with horrified disbelief. At work, my two new classes are keeping me plenty busy, and their content is quite distinct – one is on the archaeological record of Central Asia, the other centers around Homo naledi to teach about fossils. But by complete accident, examples of scientific racism came up in the readings for each course last week.

scientific-racism

Scientific racism refers to using data or evidence from the biological and social sciences to support racist arguments, that one racial group is better or worse than another group; the groups of course, are culturally determined rather than empirically discrete biological entities. This evidence is often cherry-picked, misinterpreted, and/or outright weak. Nicolas’ Wade’s 2014 A Troublesome Inheritance is a recent example of such a work. The book’s racial claims amount to nothing more than handwaving, and so egregious is the misrepresentation of genetic evidence that nearly 150 of the world’s top geneticists signed a letter to the editor rebuking Wade for “misappropriation of research from our field to support arguments about differences among human societies.” Wade’s book has no place in scientific discourse, but then almost anyone can write a book as long as a publisher thinks it will sell.

In addition to the outright misrepresentation of scientific evidence to support racist arguments, another manifestation of scientific racism is the influence of cultural biases in the interpretation of empirical observations. This may be less malicious than the first example, but is equally dangerous as it more tacitly supports systemic and pervasive racism. And this brings us to my classes’ recent readings.

First was a reference to the “Movius Line” in a review of the Paleolithic record of Central Asia (Vishnyatsky 1999) for my prehistory class. Back in the 1940s Hallum Movius, archaeologist and amazing-name-haver, noticed a distinct geographic pattern in the distribution of early stone tool technology across the Old World: “hand-axes” could be found at sites across Africa and western Eurasia, while they were largely absent from East Asian sites, which were dominated by more basic stone tools.

screen-shot-2017-02-25-at-8-28-56-am

Movius’ illustration of the distribution of Early Paleolithic technologies. From Fig. 1 in Dennell (2015).

Robin Dennell (2016) provides a nice review of how Movius’ personal, culturally influenced perception of China colored his interpretation of this pattern. Movius read this archaeological evidence to mean that early East Asian humans were unable to create the more advanced technology of the west, a biological and cognitive deficiency resulting from cultural separation: “East Asia gives the impression of having acted (just as historical China and in sharp contrast with the Mediterranean world) as an isolated and self-sufficient area, closed to any major human migratory wave” (Movius 1941: 86, cited in Dennell 2015). Racial and cultural stereotypes about East Asia directly translated to his interpretation of an archaeological pattern.

This type of old school scientific racism also arose in a review of endocasts (Falk, 2014) for my Homo naledi class. Endocasts are negative impressions or casts of a space or cavity, and comprise the only direct evidence of what extinct animals’ brains looked like. So to see how the structure of the brain has changed over the course of human evolution, scientists can search for the impressions of important brain structures in fossil human endocasts. Falk (2014) reviews one of the most famous of these structures – the “lunate sulcus” – which was used as evidence for reorganization of the hominin brain for nearly 100 years. In the early 20th century, anatomist and anthropologist GE Smith (not GE Smith from the Saturday Night Live Band)  thought he’d identified the human homologue of a groove that in apes separates the parietal lobe from the visual cortex. In humans, however, this groove was positioned more toward the back of the brain, which Smith interpreted as an expansion of an area relating to advanced cognition.

Screen Shot 2017-02-25 at 9.07.54 AM.png

The back of the brain, viewed from the left, of a chimpanzee (left) and two humans, the red line illustrating the Affenspalte or lunate sulcus (Fig. 1 from Falk 2014, which was modified from Smith 1903). The middle one also might be a grumpy fish.

It turns out that the lunate sulcus does not actually exist in humans, as the grooves identified as such are not structurally or functionally the same as the lunate sulcus in apes (Allen et al., 2006). Nevertheless, given what Smith thought the lunate sulcus was, it’s tragic to read his interpretations of human variation: “resemblance to the Simian [ape] pattern… is not quite so obvious…. in European types of brain….” (Smith 1904: 437, quoted in Falk 2014). The human condition for this trait was for it to be located in the back, reflecting an expansion of the cognitive area in front of it, and this pattern was less pronounced, according to Smith, in non-European people’s brains. This interpretation reflects two traditions at the time: 1) to refer to racial ‘types,’ ignoring variation within and overlap between groups, as well as 2) the prevailing wisdom that Europeans were more intelligent or advanced than other geographical groups.

ResearchBlogging.orgAnecdotes such as these may seem like mere scientific and historical curios, but they should serve as important reminders both that science can be accidentally guided by cultural values, or intentionally used for malevolent ends. Misconceptions and errors of the past shouldn’t be erased, but rather touted so that we don’t repeat mistakes that can have major consequences in our not-so-post-racial society.

References

Allen JS, Bruss J, & Damasio H (2006). Looking for the lunate sulcus: a magnetic resonance imaging study in modern humans. The anatomical record. Part A, Discoveries in molecular, cellular, and evolutionary biology, 288 (8), 867-76 PMID: 16835937

Dennell, R. (2016). Life without the Movius Line: The structure of the East and Southeast Asian Early Palaeolithic Quaternary International, 400, 14-22 DOI: 10.1016/j.quaint.2015.09.001

Falk D (2014). Interpreting sulci on hominin endocasts: old hypotheses and new findings. Frontiers in human neuroscience, 8 PMID: 24822043

Vishnyatsky L (1999). The Paleolithic of Central Asia. Journal of World Prehistory, 13, 69-122.

Updated bioanthro syllabi

This term I’m teaching two of my favorite classes, and I’ve updated their syllabi on my Teaching page. First is a 200-level class about human biological variation and issues surrounding race.  Second is my baby, a 300-level on human evolutionary developmental biology. If you want to teach these kinds of classes but don’t want to reinvent the wheel, feel free to use these syllabi to develop your own!

Here are the course descriptions:

Ant 263: Humans and Race
This course examines the nature of human biological variation, in the contexts of genetics, anatomy, history, and society. Students will learn about why humans vary, what this variation does and does not tell us about people, and the ways in which social inequality becomes manifest in human biology. The course will begin by surveying biological variation, both adaptive and selectively neutral, in humans. We will then focus on what the term ‘race’ means biologically, and why this concept does not describe human variation. Moving from biology and genetics, we examine psychological and historical origins of racialist thinking in the United States. This historical overview segues into an analysis of how racial categories are used in biomedical research today. Through the framework of the developmental origins of health and disease, we review the biological mechanisms whereby social inequality results in health disparity.

Ant 364: Human Evolutionary Developmental Biology
What literally makes us human? This class will examine how growth and development were modified over the course of human evolution, to create the animals that we are today. Human anatomy is placed in an evolutionary context by comparison with living primates and the human fossil record. The first half of the course focuses on theory, namely evolution, genetics and life history. The second half examines evidence for the development and evolution of specific parts of the body, from head to toe.

Bioanthro lab activity: Hominin brain size

Last week in my Human Evolution class we looked at whether we could estimate hominin brain sizes, or endocranial volumes (ECV), based on just the length and width of the bony brain case. Students took these measurements on 3D surface scans…

Maximum cranial length in Australopithecus boisei specimen KNM-ER 406.

Maximum cranial length in Australopithecus boisei specimen KNM-ER 406.

… and then plugged their data into equations relating these measurements to brain size in chimpanzees (Neubauer et al., 2012) and humans (Coqueugniot and Hublin, 2012).

The relationship between cranial length (x axis) and ECV (y axis).

The relationship between cranial length (x axis) and ECV (y axis). Left shows the chimpanzee regression (modified from Fig. 2 in Neubauer et al., 2012), while the right plot is humans (from the Supplementary Materials of Coqueugniot and Hublin, 2012).

So in addition to spending time with fossils, students also learned about osteometric landmarks with fun names like “glabella” and “opisthocranion.” More importantly, students compared their estimates with published endocranial volumes for these specimens, based on endocast measurements:

Human and chimpanzee regression equations don't do great at estimating hominin brain sizes.

Human and chimpanzee regression equations don’t do great at predicting hominin brain sizes. Each point is a hominin fossil, the x value depicting its directly-measured endocranial volume and the y value its estimated volume based on different regression equations. Black and red points are estimates based on chimpanzee cranial width and length, respectively, while green and blue points are based on human width and length, respectively. The dashed line shows y=x, or a correct estimate.

This comparison highlights the point that regression equations might not be appropriate outside of the samples on which they are developed. Here, estimates based on the relationship between cranial dimensions and brain size in chimpanzees tend to underestimate fossils’ actual values (black and red in the plot above), while the human regressions tend to overestimate hominins’ brain sizes. Students must think about why these equations perform poorly on fossil hominins.

Most of the fossil scans come from AfricanFossils.org, but a few are from Artec’s sample gallery. One of the cool, fairly recent humans at African Fossils (KNM ER 5306) will give students something else to think about:

"Why doesn't this look like the rest of the human crania we've seen this semester?"

“Why doesn’t this look like the rest of the human crania we’ve seen this semester?”

Here are the lab materials so you can use and adapt this for your own class:

Lab 4-Brain size (Instructions & questions)

Lab 4 data table (with equations)

ResearchBlogging.orgReferences
Coqueugniot, H., & Hublin, J. (2012). Age-related changes of digital endocranial volume during human ontogeny: Results from an osteological reference collection American Journal of Physical Anthropology, 147 (2), 312-318 DOI: 10.1002/ajpa.21655

Neubauer, S., Gunz, P., Schwarz, U., Hublin, J., & Boesch, C. (2012). Brief communication: Endocranial volumes in an ontogenetic sample of chimpanzees from the taï forest national park, ivory coast American Journal of Physical Anthropology, 147 (2), 319-325 DOI: 10.1002/ajpa.21641

Bioanthro lab activity: Sexual dimorphism

A few weeks ago we examined sexual dimorphism – characteristic differences between males and females – in my Intro to Bioanthro class. Sexual dimorphism roughly correlates with aspects of social behavior in animals, and so we compared dimorphism in our class with what is seen in other primates. For the lab, we collected our body masses, heights, and lengths of our 2nd and 4th fingers, then I plotted the data and we went over it together.

When collecting data on your students, make sure to get permission from your institution and let students know they can opt out of sharing their personal data. I’ve also assigned students randomized ID numbers to help keep their data private and as anonymous as possible.

This activity builds on the first lab we did this year, measuring our head circumferences to estimate brain size and examining how this varies within the classroom. We saw then that our class’s males have  larger brain (well, head) sizes than females. We hypothesized that this was simply due to body size differences – all else being equal, larger people should have larger brains. Now that we collected body mass data, we could test this hypothesis – in fact, when body mass is taken into account, our class’s females have larger brains than males:

Sexual dimorphism in brain size (left), body size (center), and brain/body size.

Sexual dimorphism in brain size (left), body size (center), and brain size relative to body size (right).

These are sex differences based on raw numbers. Another way to look at dimorphism is to se the extent to which sexes deviate from a scaling relationship (“allometry”). Looking to the left plot below, there is a positive linear relationship between body and brain size: as body size increases, so does brain size. As we saw above, male values are elevated above females’ but there is overlap. Importantly, the right plot shows that deviations from this linear trend, quantified as residuals, are not significantly different for the two sexes. So even though females have large brains relative to their body size in absolute terms, this is not exceptional given how brain size scales with body size.

Brain-body allometry in our classroom. Males and females in our classroom do not seem to deviate appreciably from a common pattern of allometry.

Brain-body allometry in our classroom. Males and females in our classroom do not seem to deviate appreciably from a common pattern of allometry.

While lab activities help students to understand patterns in data, this lab also shows students the importance of comparing patterns of variation.  Students learn from readings and lectures that humans show relatively low levels of dimorphism, and this activity helps them see why we say that. Situating our data within the context of primate dimorphism and mating systems, they can ask if there is an adaptive or evolutionary significance behind our level of dimorphism.

Sexual dimorphism in our classroom compared with what is seen in primates with different mating systems and levels male-male competition. Our class values are the stars, and in the right plot blue is males and green is females. Figures from Plavcan (2012) and Nelson & Schultz (2010).

Sexual dimorphism in our classroom compared with what is seen in primates with different mating systems and levels male-male competition. Our class values are the stars, and in the right plot blue is males and green is females. Figures from Plavcan (2012) and Nelson & Schultz (2010).

In this broader comparative context, students tackle what it means for human dimorphism, and ratios of the 2nd digit/4th digit, to be intermediate between what we see in monogamous vs. non-monogamous primates. This can lead some interesting class discussion.

Handout: Lab 3-Sexual dimorphism (Instructions and questions)

ResearchBlogging.orgReferences
 Nelson E, & Shultz S (2010). Finger length ratios (2D:4D) in anthropoids implicate reduced prenatal androgens in social bonding. American Journal of Physical Anthropology, 141 (3), 395-405. PMID: 19862809

Plavcan JM (2012). Sexual size dimorphism, canine dimorphism, and male-male competition in primates: where do humans fit in? Human Nature, 23 (1), 45-67. PMID: 22388772

Bioanthro lab activity: What species is it?

We’re learning about the divergence between robust Australopithecus and early Homo 2.5-ish million years ago in my Human Evolution class this week. Because of this multiplicity of contemporaneous species, when scientists find new hominin fossils in Early Pleistocene sites, a preliminary question is, “What species is it?”

Screen Shot 2015-10-30 at 10.42.22 AM

Scrutinizing the fossil record, asking the difficult questions. (Science credit)

To help my students learn how we know whether certain fossils belong to the same species, and to which group new fossils might belong, in this week’s lab we compared tooth sizes of Australopithecus boisei and early Homo. After seeing how tooth sizes differed between these groups, students then tested whether they could determine whether two “mystery” fossils (KNM-ER 60000 and 62000; Leakey et al. 2012) belonged either group.

Early Pleistocene hominin fossils from Kenya. Left to right: KNM-ER 406, ER 62000 and ER 1470.

Early Pleistocene hominin fossils from Kenya. Left to right: KNM-ER 406, ER 62000 and ER 1470. At the center is one f the lab’s “mystery jaws.”

Students downloaded 3D scans of hominin fossils from AfricanFossils.org, and measured buccolingual/labiolingual tooth crown diameters using MeshLab.

Early Pleistocene hominin mandibles. Left to right: KNM-ER 3230, ER 60000 ("mystery" jaw) and ER 1802.

Early Pleistocene hominin mandibles. Left to right: KNM-ER 3230, ER 60000 (“mystery” jaw) and ER 1802.

The first purpose of this lab was to help familiarize students with skull and tooth anatomy of early Pleistocene humans. Although lectures and readings are full of images, a lab activity forces students to spend time visually examining fossils. Plus, they’re in 3D which is a whole D greater than 2D – the visual equivalent of going to eleven! The second goal of the lab was to help prepare students for their term projects, in which they must pose a research question about human evolution, generate predictions, and find and use data to test hypotheses.

If you’re interested in using or adapting this activity for your class, here are the handout and data sheet into which students enter their measurements. The data sheet specifies the fossils that can be downloaded from africanfossils.org.  Some relevant fossils (i.e., KNM WT 15000 and ER 992) were not included because the 3D scans yield larger measurements than in reality.

Lab 3-Mystery Jaws (instructions and questions)

Lab 3-Mystery jaws data sheet

ResearchBlogging.orgReference
Leakey MG, Spoor F, Dean MC, Feibel CS, Antón SC, Kiarie C, & Leakey LN (2012). New fossils from Koobi Fora in northern Kenya confirm taxonomic diversity in early Homo. Nature, 488 (7410), 201-4 PMID: 22874966

Gracile & robust Australopithecus

Last week, I introduced my Human Evolution students to the “robust” australopithecines. It was a very delicate time, when we had to have a grown up, mature conversation about adult things. I reminded the students that they’re only human, but they must resist urges that seem only natural. No matter how much they want to, even if their friends are doing it, they must not act on the deep, dark desire to say that “robust” vs. “gracile” Australopithecus differ in their body build.

Don't do it, Homo naledi. Don't talk about body size when you mean to talk about jaw and tooth size. Illustration by Flos Vingerhoets.

Don’t do it, Homo naledi. Don’t talk about body size when you mean to talk about jaw and tooth size. Illustration by Flos Vingerhoets.

Every semester, students (who don’t read and/or pay attention to lecture) think that the difference between these two groups has to do with the species’ body sizes. This is a misconception that has reached the highest echelons of reference:

At least one person is not citing their source here. F-.

Apple and Google, at least one person here is not citing their source: F-. Also, is no one else surprised that this term is allegedly specific to anthropology?

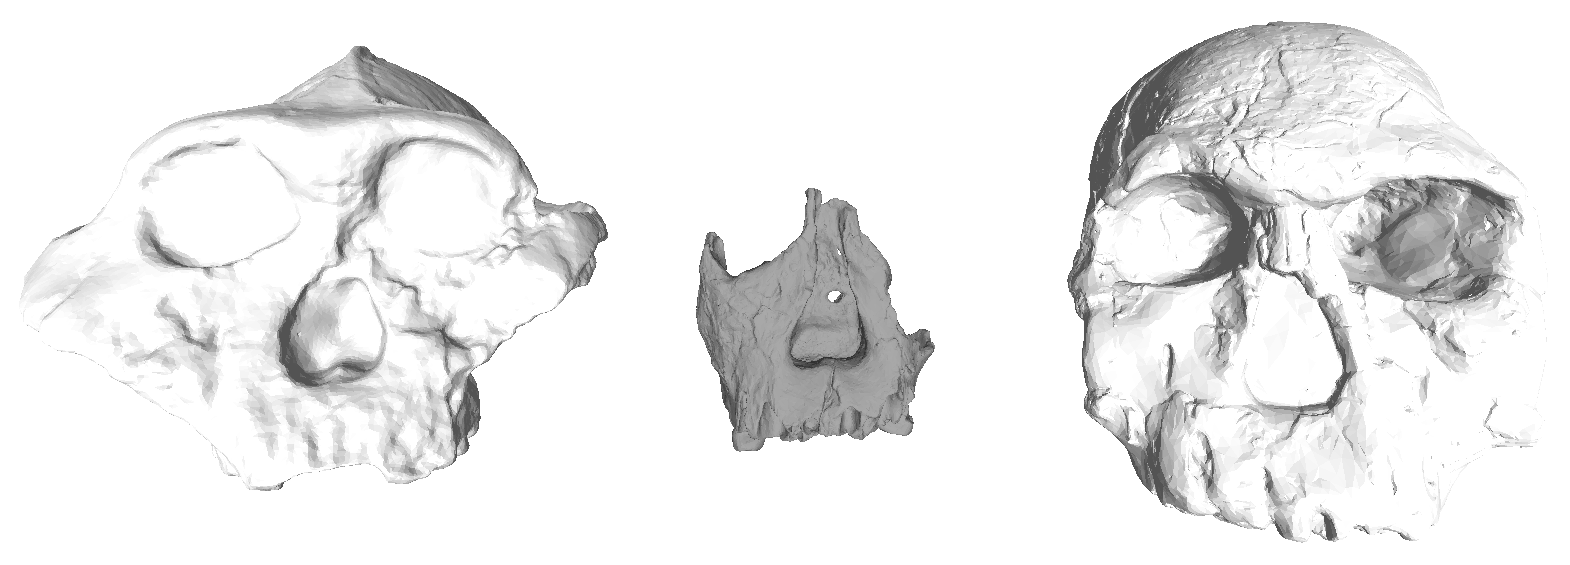
No. In the case of australopiths, “gracile” and “robust” refer to the relative size of the jaws, teeth and chewing muscles (all contributing to the “masticatory apparatus”). Traditionally,  graciles include the ≥2 million year old Australopithecus afarensis and africanus, and robusts include the later A. boisei and robustus. The discovery of an A. aethiopicus cranium (Walker et al. 1986) somewhat blurred the lines between the two groups but it is usually included with the robusts (who are often collectively called Paranthropus). John Fleagle’s classic textbook (1999) illustrates the gracile-robust dichotomy very nicely:

Comparison of gracile (left) and robust (right) craniodental traits. From Fleagle, 1999.

So to recap: Jaws and teeth, people! To the best of my knowledge, there’s little or no evidence that the various australopithecines differed appreciably in body size (McHenry and Coffing, 2000), stoutness, or muscularity. Although the OH 80 partial skeleton, attributed to Australopithecus boisei  based on tooth size and proportions, includes a humerus with very thick cortical bone and a radius with a crazy big insertion for the biceps muscle – it was a very large and muscular A. boisei (Domínguez-Rodrigo et al., 2013). Nevertheless, gracile and robust australopithecine species differ most notably in their jaws and teeth, not bodies. Maybe this is why Liz Lemon was so confused about the term “robust”?

Today, these are somewhat antiquated terms. Back when the only hominins known to science were the species listed above, it was easy to make a distinction. However, as the fossil record has expanded of late, the gracile-robust dichotomy becomes blurry. Australopithecus garhi (Asfaw et al., 1999) has overall tooth proportions comparable to graciles, but absolute tooth sizes and sagittal cresting like robusts. The recently described Australopithecus deyiremeda has tooth sizes and proportions like graciles but lower jaws that are very thick, like those of robust australopithecines (Haile-Selassie et al., 2015).

So in light of all the confusion and blurring distinctions, maybe it’s time to scrap “gracile” vs. “robust”?

Further reading:  The “robust” australopiths (Constantino, 2013), I also wrote up a short reference chapter here.

ResearchBlogging.org

References
Asfaw B, White T, Lovejoy O, Latimer B, Simpson S, & Suwa G (1999). Australopithecus garhi: a new species of early hominid from Ethiopia. Science (New York, N.Y.), 284 (5414), 629-35 PMID: 10213683

Domínguez-Rodrigo, M., Pickering, T., Baquedano, E., Mabulla, A., Mark, D., Musiba, C., Bunn, H., Uribelarrea, D., Smith, V., Diez-Martin, F., Pérez-González, A., Sánchez, P., Santonja, M., Barboni, D., Gidna, A., Ashley, G., Yravedra, J., Heaton, J., & Arriaza, M. (2013). First Partial Skeleton of a 1.34-Million-Year-Old Paranthropus boisei from Bed II, Olduvai Gorge, Tanzania PLoS ONE, 8 (12) DOI: 10.1371/journal.pone.0080347

Haile-Selassie Y, Gibert L, Melillo SM, Ryan TM, Alene M, Deino A, Levin NE, Scott G, & Saylor BZ (2015). New species from Ethiopia further expands Middle Pliocene hominin diversity. Nature, 521 (7553), 483-8 PMID: 26017448

Walker, A., Leakey, R., Harris, J., & Brown, F. (1986). 2.5-Myr Australopithecus boisei from west of Lake Turkana, Kenya Nature, 322 (6079), 517-522 DOI: 10.1038/322517a0

Bioanthro lab activity: Primate proportions

My Intro to Bio Anthro course, focusing on human uniqueness, has moved from the brain to bipedalism. After the abysmally big brain, perhaps the most grotesque aspect of the human species is our wont to walk on two legs. It’s just not natural.

Image credit.

What a terrible biped. Image credit.

Seriously, why would an animal do such a horrid thing?

Image credit.

Most animals need extra help to stay upright on just two limbs. Image credit.

This peripatetic penchant is apparent in our skeletons, most visibly in our long-ass legs. And indeed, species’ limb lengths and proportions generally reflect how they tend to move around. Quadrupeds, animals that walk on four legs, tend to have roughly equally-lengthed arms and legs. Gibbons, notorious ricochetal brachiators, have insanely long arms. So for lab this week, students measured surface scans of different primates’ long bones to see if form really follows function.

Here, students try their hands at measuring long bones on surface scans of primate skeletons, and use their data to calculate indices reflecting the relative lengths of limb segments. These data will be used to test whether limb proportions can be used to distinguish different locomotor types, and to hypothesize how fossil species might have moved about.

Measuring siamang (Symphalangus syndactylus) limb lengths with Meshlab. Data credit.

Measuring siamang (Symphalangus syndactylus) limb lengths with Meshlab. Data credit.

Since this is my students’ introduction to primate skeletons and analysis software, I only had them measure three specimens: a siamang (above), a squirrel monkey, and a grivet.  But of course you can have students look at more if you wish. This activity uses the free Meshlab software  and surface scans made from CT scans in the KUPRI database (surface scans are much smaller files than CT scans, making for easier dissemination to swarms of students). If you’re interested in using or modifying this activity in your class, here are the lab handout and datasheet I created for it:

Lab 2-Primate proportions
Lab 2-Primate limb data sheet

Info about, and materials for, other lab activities can be found on my Teaching page.

Bioanthro lab activity: Estimating Miocene ape body mass

We’ve arrived at the Planet of the Apes, also known as the Miocene, in my “Bones, Stones and Genomes” course. The living apes are but a small remnant of what was a pretty successful radiation starting around 20 million years ago. There were so many apes that it can be a bit confusing for students, but it’s important for setting up the biological and ecological contexts of hominin origins.

Possible evolutionary relationships of myriad Miocene apes and subsequent hominins. From Harrison (2010)

Possible evolutionary relationships of myriad Miocene apes and subsequent hominins. From Harrison (2010)

This week also marks my students’ first lab assignment, analyzing CT scans of bones. Here, we looked at how we estimate body size in extinct animals, using the KUPRI database and the free CT analysis software InVesalius. Because some of the KUPRI primates have body masses recorded, students can examine the relationship between animals’ weight and skeletal dimensions. The purpose of the assignment is to help familiarize students with skeletal anatomy, CT data and principles of linear regression.

One of the KUPRI specimens, an old female gorilla, with known weight.

One of the KUPRI specimens, an old female gorilla, with known weight.

I selected a few specimens for students to examine. After students download the massive files, they can load them into InVesalius for analysis. This program allows students to easily identify bone versus other tissues, and to create a 3D surface rendering of a highlighted region (tissue) of interest.

A grivet, Chlorocebus aethiops, with bone highlighted in 2D sections and as a 3D model.

A grivet, Chlorocebus aethiops, with bone highlighted in 2D sections and as a 3D model. This little guy weighs only 4 kg!

It’s pretty easy to take simple linear measurements (and angles), assuming students can get oriented within the skeleton and identify the features they need to measure. It can be a little tricky to measure a femur head if it’s still in the acetabulum (below). Luckily, InVesalius lets you take measurements on both 2D slices or the 3D volume.

Let's measure that femur head diameter.

Let’s measure that femur head diameter.

So students do this for a few specimens and enter the data into Excel, which can then easily plot the data and provide a regression equation. They then use this equation to estimate masses of the specimens – if there’s a good relationship between mass and skeletal measures, then the estimates should be close to the observed values. Students use their equation to predict body mass of some Miocene apes based on femur head diameter and femur midshaft diameter, noting how confident they feel in their estimates given how well their regression performed on the training dataset. They also compare their mass estimates to those using another equation generated by Christopher Ruff (2003).

It might be a little intense for students totally unfamiliar with apes, bones and CT scans, but it should be a good way for them to learn lots of concepts we’ll revisit over the semester.

Here’s the lab assignment, in case you want to use it in your own class: Lab 1-Miocene masses