Osteology Everywhere: Aerial Ossicles

Last month I was flying down to New Orleans for the AAPA conference. I was excited to try authentic beignets & sazeracs, present new research, and catch up with colleagues. Midway through the flight I glanced out the window, not expecting to see much. But lo!

twilight

Thankfully there wasn’t something on the wing. But there was something strange out there in the sparkle of sprawling city lights:

IMG_20170419_084210_479

What’s that I spy outside the city center?

A bit outside of the main jumble of street lamps appears to be a concentration of light superficially similar to an incus, one of the three auditory ossicles of the middle ear:

nightmare

Left: An osteologist’s nightmare at 20,000 feet. Right: Ear ossicles from White et al. (2012).

As a good mammal, there are three small bones inside your middle ear. These are fully formed at birth, and help transfer and amplify sound vibrations from your eardrum to your inner ear. It’s nuts. What’s even more nuts is that paleontologists and anatomists have figured out that the tiny, internal incus and malleus of mammals evolved from larger, external pieces of the jaws of our pre-mammalian ancestors. INSANITY!

anatomy-of-the-inner-ear-chart2b1

Cross section of a right ear, viewed from the front. Image credit.

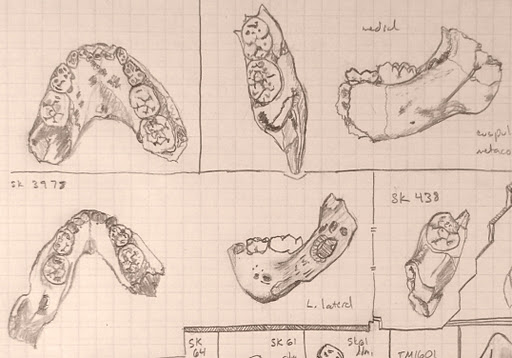
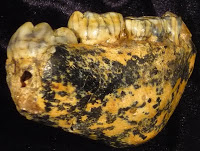
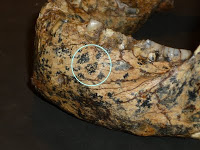
Being so tiny, it’s not surprising that auditory ossicles are not often recovered from skeletal remains, and are pretty rare in the human fossil record. Nevertheless, some are known and their comparison with humans’ ossicles is pretty interesting. The oldest inci I know of are from SK 848 and SKW 18Australopithecus robustus fossils from Swartkrans in South Africa (Rak and Clarke, 1979; Quam et al., 2013). SK 848 is on the left in the set of images below:

Ossicles

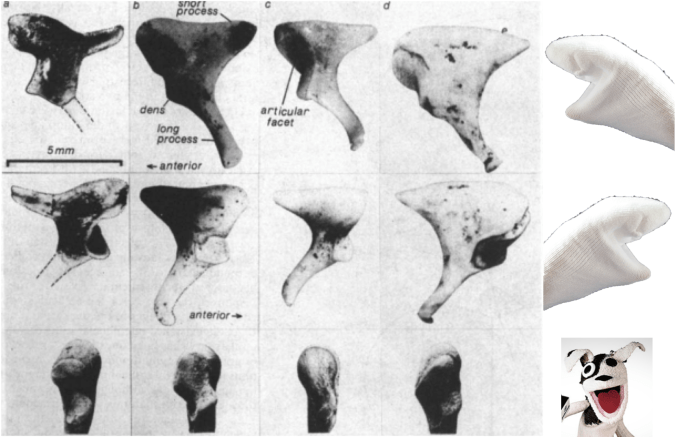
Incus bones in three different views of SK 848, human chimpanzee, gorilla, sock puppet (left to right). Modified from Rak and Clarke, 1979.

SK 848 to differs from humans and African apes in looking more like a screaming sock puppet with a horn on the back of its head. Additional ossicles are known from South African australopithecines, including the older A. africanus from Sterkfontein (Quam et al., 2013). Interestingly, malleus of these hominins is very similar to that of humans, and Quam et al. (2013) think this ossicle may be one of the first bones in the entire skeleton to take on a human-like configuration during hominin evolution. Functionally, this may mean that the frequency range to which human ears are adapted may have appeared pretty early in our lineage as well (Quam et al., 2015).

Who’d’ve thunk we’d learn so much just from looking out an airplane window?

anthropology
ResearchBlogging.orgRead more!

Quam, R., de Ruiter, D., Masali, M., Arsuaga, J., Martinez, I., & Moggi-Cecchi, J. (2013). Early hominin auditory ossicles from South Africa Proceedings of the National Academy of Sciences, 110 (22), 8847-8851 DOI: 10.1073/pnas.1303375110

Quam, R., Martinez, I., Rosa, M., Bonmati, A., Lorenzo, C., de Ruiter, D., Moggi-Cecchi, J., Conde Valverde, M., Jarabo, P., Menter, C., Thackeray, J., & Arsuaga, J. (2015). Early hominin auditory capacities Science Advances, 1 (8) DOI: 10.1126/sciadv.1500355

Rak Y, & Clarke RJ (1979). Ear ossicle of australopithecus robustus. Nature, 279 (5708), 62-3 PMID: 377094

Dietary divergence of robust australopithecines

I’m writing a review of the “robust” australopithecines, and I’m reminded of how drastically our understanding of these hominins has changed in just the past decade. Functional interpretations of the skull initially led to the common wisdom that these animals ate lots of hard foods, and had the jaws and teeth to cash the checks written by their diets.

Screen Shot 2016-07-28 at 9.28.43 AM

Comparison of a “gracile” (left) and “robust” (right) Australopithecus face, from Robinson (1954).

While anatomy provides evidence of what an animal could have been eating, there is more direct evidence of what animals actually did eat. Microscopic wear on teeth reflects what kinds of things made their way into an animal’s mouth, presumably as food, and so provide a rough idea of what kinds of foods an animal ate in the days before it died. Microwear studies of A. robustus from South Africa had confirmed previous wisdom: larger pits and more wear complexity in A. robustus than in the earlier, “gracile” A. africanus suggested more hard objects in the robust diet (e.g., Scott et al., 2005). A big shock came a mere 8 years ago with microwear data for the East African “hyper robust” A. boisei: molars had many parallel scratches and practically no pitting, suggesting of a highly vegetative diet (Ungar et al. 2008).

robust microwear

Microwear in A. boisei (blue) and A. robustus (red). Although they overlap mostly for anisotropy (y-axis), they are completely distinct for complexity (x-axis). Data from Grine et al. (2012) and skull diagrams from Kimbel et al. (2004).

Stable carbon isotope analysis, which assesses what kinds of plant-stuffs were prominent in the diet when skeletal tissues (e.g. teeth) formed, further showed that the two classically “robust” hominins (and the older, less known A. aethiopicus) ate different foods. Whereas A. robustus had the carbon isotope signature of an ecological generalist, A. boisei had values very similar to gelada monkeys who eat a ton of grass/sedge. GRASS!

robust isotopes

Stable carbon isotope data for robust australopithecines. Data from Cerling et al. (2013) and skull diagrams from Kimbel et al. (2004). Note again the complete distinction between A. robustus (red) and A. boisei (blue).

ResearchBlogging.orgWhile microwear and isotopes don’t tell us exactly what extinct animals ate, they nevertheless are much more precise than functional anatomy and help narrow down what these animals ate and how they used their environments. This highlights the importance of using multiple lines of evidence (anatomical, microscopic, chemical) to understand life and ecology of our ancient relatives.

REFERENCES

Cerling TE, Manthi FK, Mbua EN, Leakey LN, Leakey MG, Leakey RE, Brown FH, Grine FE, Hart JA, Kaleme P, Roche H, Uno KT, & Wood BA (2013). Stable isotope-based diet reconstructions of Turkana Basin hominins. Proceedings of the National Academy of Sciences, 110 (26), 10501-6 PMID: 23733966

Grine FE, Sponheimer M, Ungar PS, Lee-Thorp J, & Teaford MF (2012). Dental microwear and stable isotopes inform the paleoecology of extinct hominins. American Journal of Physical Anthropology, 148 (2), 285-317 PMID: 22610903

Kimbel WH, Rak Y, & Johanson DC (2004). The Skull of Australopithecus afarensis. Oxford University Press.

Robinson, J. (1954). Prehominid Dentition and Hominid Evolution Evolution, 8 (4) DOI: 10.2307/2405779

Ungar PS, Grine FE, & Teaford MF (2008). Dental microwear and diet of the Plio-Pleistocene hominin Paranthropus boisei. PloS One, 3 (4) PMID: 18446200

The strange days of yore

Today is not like the good ol’ days. In many ways things have changed for the better. For instance, in the good ol’ days, many paleontologists would find fossils but let nary a soul examine them; today, you can download high quality 3D models of many important fossils from both East and South Africa, completely for free!

Robert Broom’s (1938) account of the discovery of the first Paranthropus (or Australopithecus) robustus is also a reminder of the strangeness of the bygone days of yore:

Screen Shot 2016-06-23 at 5.57.24 PM

Wait for it …

In June of this year a most important discovery was made. A schoolboy, Gert Terblanche, found in an outcrop of bone breccia near the top of a hill, a couple of miles from the Sterkfontein caves, much of the skull and lower jaw of a new type of anthropoid. Not realizing the value of the find, he damaged the specimen considerably in hammering it out of the rock. The palate with one molar tooth he gave to Mr. Barlow at Sterkfontein, from whom I obtained it. Recognizing that some of the teeth had recently been broken off, and that there must be other parts of the skull where the palate was found, I had to hunt up the schoolboy. I went to his home two miles off and found that he was at the school another two miles away, and his mother told me that he had four beautiful teeth with him. I naturally went to the school, and found the boy with four of what are perhaps the most valuable teeth in the world in his trouser pocket. He told me that there were more bits of the skull on the hillside. After school he took me to the place and I gathered every scrap I could find; and when these were later examined and cleaned and joined up, I found I had not only the nearly perfect palate with most of the teeth, but also practically the whole of the left side of the lower half of the skull and the nearly complete right lower jaw.

What a wild time – Broom hunts down poor Gert, barges into the school, then makes the kid show him where he hacked the skull out of the rock. Poor, poor Gertie.

Maybe it was a different Gertie, but surely the reaction was the same.

Maybe it was a different Gertie, but surely the reaction was the same.

Of course, there was a lot at stake. I mean, brazen Gert harbored not just “beautiful teeth,” but “the most valuable teeth in the world.” IN HIS TROUSERS! And of course Gert was also the soul possessor of priceless intel – the source of the fossils. So maybe Broom was justified in this zealous abduction. And O! such prose in a Nature paper! WAS IT WORTH IT, DR. BROOM?

At Sterkfontein, a bronzed Broom considers the weight of his actions.

At Sterkfontein, a bronzed Broom considers the weight of his actions.

Of course, Gert wasn’t the last kid to discover an important human fossil. The game-changing Australopithecus sediba  was discovered when Matthew Berger, son of famed Lee Berger and only 9 years old at the time, saw a piece of a clavicle sticking out of a block of breccia. Both Gert and Matthew show that you don’t have to be a doctor to make amazing discoveries. What future fossil discoveries will be made by kids, and making my adult accomplishments pale in comparison?!

Gracile & robust Australopithecus

Last week, I introduced my Human Evolution students to the “robust” australopithecines. It was a very delicate time, when we had to have a grown up, mature conversation about adult things. I reminded the students that they’re only human, but they must resist urges that seem only natural. No matter how much they want to, even if their friends are doing it, they must not act on the deep, dark desire to say that “robust” vs. “gracile” Australopithecus differ in their body build.

Don't do it, Homo naledi. Don't talk about body size when you mean to talk about jaw and tooth size. Illustration by Flos Vingerhoets.

Don’t do it, Homo naledi. Don’t talk about body size when you mean to talk about jaw and tooth size. Illustration by Flos Vingerhoets.

Every semester, students (who don’t read and/or pay attention to lecture) think that the difference between these two groups has to do with the species’ body sizes. This is a misconception that has reached the highest echelons of reference:

At least one person is not citing their source here. F-.

Apple and Google, at least one person here is not citing their source: F-. Also, is no one else surprised that this term is allegedly specific to anthropology?

No. In the case of australopiths, “gracile” and “robust” refer to the relative size of the jaws, teeth and chewing muscles (all contributing to the “masticatory apparatus”). Traditionally,  graciles include the ≥2 million year old Australopithecus afarensis and africanus, and robusts include the later A. boisei and robustus. The discovery of an A. aethiopicus cranium (Walker et al. 1986) somewhat blurred the lines between the two groups but it is usually included with the robusts (who are often collectively called Paranthropus). John Fleagle’s classic textbook (1999) illustrates the gracile-robust dichotomy very nicely:

Comparison of gracile (left) and robust (right) craniodental traits. From Fleagle, 1999.

So to recap: Jaws and teeth, people! To the best of my knowledge, there’s little or no evidence that the various australopithecines differed appreciably in body size (McHenry and Coffing, 2000), stoutness, or muscularity. Although the OH 80 partial skeleton, attributed to Australopithecus boisei  based on tooth size and proportions, includes a humerus with very thick cortical bone and a radius with a crazy big insertion for the biceps muscle – it was a very large and muscular A. boisei (Domínguez-Rodrigo et al., 2013). Nevertheless, gracile and robust australopithecine species differ most notably in their jaws and teeth, not bodies. Maybe this is why Liz Lemon was so confused about the term “robust”?

Today, these are somewhat antiquated terms. Back when the only hominins known to science were the species listed above, it was easy to make a distinction. However, as the fossil record has expanded of late, the gracile-robust dichotomy becomes blurry. Australopithecus garhi (Asfaw et al., 1999) has overall tooth proportions comparable to graciles, but absolute tooth sizes and sagittal cresting like robusts. The recently described Australopithecus deyiremeda has tooth sizes and proportions like graciles but lower jaws that are very thick, like those of robust australopithecines (Haile-Selassie et al., 2015).

So in light of all the confusion and blurring distinctions, maybe it’s time to scrap “gracile” vs. “robust”?

Further reading:  The “robust” australopiths (Constantino, 2013).

ResearchBlogging.org

References
Asfaw B, White T, Lovejoy O, Latimer B, Simpson S, & Suwa G (1999). Australopithecus garhi: a new species of early hominid from Ethiopia. Science (New York, N.Y.), 284 (5414), 629-35 PMID: 10213683

Domínguez-Rodrigo, M., Pickering, T., Baquedano, E., Mabulla, A., Mark, D., Musiba, C., Bunn, H., Uribelarrea, D., Smith, V., Diez-Martin, F., Pérez-González, A., Sánchez, P., Santonja, M., Barboni, D., Gidna, A., Ashley, G., Yravedra, J., Heaton, J., & Arriaza, M. (2013). First Partial Skeleton of a 1.34-Million-Year-Old Paranthropus boisei from Bed II, Olduvai Gorge, Tanzania PLoS ONE, 8 (12) DOI: 10.1371/journal.pone.0080347

Haile-Selassie Y, Gibert L, Melillo SM, Ryan TM, Alene M, Deino A, Levin NE, Scott G, & Saylor BZ (2015). New species from Ethiopia further expands Middle Pliocene hominin diversity. Nature, 521 (7553), 483-8 PMID: 26017448

Walker, A., Leakey, R., Harris, J., & Brown, F. (1986). 2.5-Myr Australopithecus boisei from west of Lake Turkana, Kenya Nature, 322 (6079), 517-522 DOI: 10.1038/322517a0

eFfing #FossilFriday: toolmakers without tools?

Matt Skinner and colleagues report in today’s Science an analysis of trabecular bone structure in the hand bones of humans, fossil hominins and living apes. Trabecular bone, the sponge-like network of bony lattices on the insides of many of your bones, adapts during life to better withstand the directions and amounts of force it experiences. This is a pretty great property of the skeleton: bone is organized in a way that helps withstand usual forces, and the spongy organization of trabeculae also keeps bones fairly lightweight. Win-win.

An X-ray of my foot. Note that most of the individual foot bones are filled with tiny 'spicules' (=trabeculae) of bone. Very often they have a very directed, or non-random, orientation, such as in the heel.

An X-ray of my foot. The individual foot bones are filled with narrow spicules (=trabeculae) of bone. Very often they have a directed, or non-random, orientation: in the calcaneus, for instance, they are oriented mostly from the heel to the ankle joint.

This adaptive nature of trabecular bone also means that we can learn a lot about how animals lived in the past when all they’ve left behind are scattered fossils. In the present case, Skinner and colleagues tested whether tool use leaves a ‘trabecular signature’ in hand bones, looking then for whether fossil hominins fit this signature. Their study design is beautifully simple but profoundly insightful: First, they compared humans and apes to see if the internal structure of their hand bones can be distinguished. Second, they tested whether these differences accord with theoretical predictions based on how these animals use their hands (humans manipulate objects, apes use hands for walking and climbing). Third, they determined whether fossil hand bones look more like either group.

Comparison of first metacarpals (the thumb bone in your palm) between a chimpanzee (left), three australopithecines, and a human (right). In each, the palm side is to the left and the wrist end of the bone (proximal) is down. Image by Tracy Kivell, and found here.

Looking at the image above, it’s difficult to spot trabecular differences between the specimens with the naked eye. But computer software can easily measure the density and distribution of trabecular bone from CT scans. With these tools, researchers found key differences between humans and apes consistent with the different ways they use their hands. Neandertals (humans in the past 100 thousand years or so) showed the human pattern, not unexpected since their bones look like ours and they used their hands to make tools and manipulate objects like we do.

What’s more interesting, though, is that the australopithecines, dating to between 1.8-3.0 million years ago, also show the human pattern. This is an important finding since the external anatomy of Australopithecus hand bones shows a mixture of human- and ape-like features, with unclear implications for how they used their hands. Their trabecular architecture, reflecting the forces their hands experienced in life, is consistent with tool use.

This is a very significant finding. Australopithecus africanus fossils from Sterkfontein aren’t associated with any stone tools; bone tools are known from Swartkrans, though it is unclear whether Australopithecus robustus or Early Homo from the site made/used these. In addition, in 2010 McPherron and colleagues reported on a possibly cut-marked animal bone from the 3.4 million year old site of Dikika in Ethiopia, where Australopithecus afarensis fossils but no tools are found. Skinner and colleagues’ results show that at the very least, South African Australopithecus species were using their hands like tool-makers and -users do.

This raises many fascinating questions – were australopithecines using stone tools, but we haven’t found them? Were they using tools made of other materials? What do the insides of Australopithecus afarensis metacarpals look like? What I like about this study is that it presents both compelling results, and raises further (testable) questions about both the nature of the earliest tools and our ability to detect their use from fossils.

A new method for analyzing growth in extinct animals (dissertation summary 1)

The last year and a half was a whirlwind, and so I never got around to blogging about the fruits of my dissertation: Mandibular growth in Australopithecus robustus… Sorry! So this post will be the first installment of my description of the outcome of the project. The A. robustus age-series of jaws allowed me to address three questions: [1] Can we statistically analyze patterns of size change in a fossil hominid; [2] how ancient is the human pattern of subadult growth, a key aspect of our life history;  and [3] how does postnatal growth contribute to anatomical differences between species? This post will look at question [1] and the “zeta test,” new method I devised to answer it.

Over a year ago, and exactly one year ago, I described some of the rational for my dissertation. Basically, in order to address questions [2-3] above, I had to come up with a way to analyze age-related variation in a fossil sample. A dismal fossil record means that fossil samples are small and specimens fragmentary – not ideal for statistical analysis. The A. robustus mandibular series, however, contains a number of individuals across ontogeny – more ideal than other samples. Still, though, some specimens are rather complete while most are fairly fragmentary, meaning it is impossible to make all the same observations (i.e. take the same measurements) on each individual. How can growth be understood in the face of these challenges to sample size and homology?

Because traditional parametric statistics – basically growth curves – are ill-suited for fossil samples, I devised a new technique based on resampling statistics. This method, which I ended up calling the “zeta test,” rephrases the question of growth, from a descriptive to a comparative standpoint: is the amount of age-related size change (growth) in the small fossil sample likely to be found in a larger comparative sample? Because pairs of specimens are likelier to share traits in common than an entire ontogenetic series, the zeta test randomly grabs pairs of differently-aged specimens from one sample, then two similarly aged specimens from the second sample, and compares the 2 samples’ size change based only on the traits those two pairs share (see subsequent posts). Pairwise comparisons maximize the number of subadults that can be compared, and further address the problem of homology. Then you repeat this random selection process a bajillion times, and you’ve got a distribution of test statistics describing how the two samples differ in size change between different ages. Here’s a schematic:

1. Randomly grab a fossil (A) and a human (B) in one dental stage (‘younger’), then a fossil and a human in a different dental stage (‘older’). 2. Using only traits they all share, calculate relative size change in each species (older/younger): the zeta test statistic describes the difference in size change between species. 3. Calculate as many zetas as you can, creating a distribution giving an idea of how similar/different species’ growth is.

The zeta statistic is the absolute difference between two ratios – so positive values mean species A  grew more than species B, while negative values mean the opposite. If 0 (zero, no difference) is within the great majority of resampled statistics, you cannot reject the hypothesis that the two species follow the same pattern of growth. During each resampling, the procedure records the identity and age of each specimen, as well as the number of traits they share in common. This allows patterns of similarity and difference to be explored in more detail. It also makes the program run for a very long time. I wrote the program for the zeta test in the statistical computing language, R, and the codes are freely available. (actually these are from April, and at my University of Michigan website; until we get the Nazarbayev University webpage up and running, you can email me for the updated codes)

The zeta test itself is new, but it’s based on/influenced by other techniques: using resampling to compare samples with missing data was inspired by Gordon et al. (2008). The calculation of ‘growth’ in one sample, and the comparison between samples, is very similar to as Euclidean Distance Matrix Analysis (EDMA), devised in the 1990s by Subhash Lele and Joan Richtsmeier (e.g. Richtsmeier and Lele, 1993). But since this was a new method, I was glad to be able to show that it works!

I used the zeta test to compare mandibular growth in a sample of 13 A. robustus and 122 recent humans. I first showed that the method behaves as expected by using it to compare the human sample with itself, resampling 2 pairs of humans rather than a pair of humans and a pair of A. robustus. The green distribution in the graph to the left shows zeta statistics for all possible pairwise comparisons of humans. Just as expected, that it’s strongly centered at zero: only one pattern of growth should be detected in a single sample. (Note, however, the range of variation in the green zetas, the result of individual variation in a cross-sectional sample)

In blue, the human-A. robustus statistics show a markedly different distribution. They are shifted to the right – positive values – indicating that for a given comparison between pairs of specimens, A. robustus increases size more than humans do on average.

We can also examine how zeta statistics are distributed between different age groups (above). I had broken my sample into five age groups based on stage of dental eruption – the plots above show the distribution of zeta statistics between subsequent eruption stages, the human-only comparison on the left and the human-A. robustus comparison on the right. As expected, the human-only statistics center around zero (red dashed line) across ontogeny, while the human-A. robustus statistics deviate from zero markedly between dental stages 1-2 and 3-4. I’ll explain the significance of this in the next post. What’s important here is that the zeta test seems to be working – it fails to detect a difference when there isn’t one (human-only comparisons). Even better, it detects a difference between humans and A. robustus, which makes sense when you look at the fossils, but had never been demonstrated before.

So there you go, a new statistical method for assessing fossil samples. The next two installments will discuss the results of the zeta test for overall size (important for life history), and for individual traits (measurements; important for evolutionary developmental biology). Stay tuned!

ResearchBlogging.org Several years ago, when I first became interested in growth and development, I changed this blog’s header to show this species’ subadults jaws – it was only last year that I realized this would become the focus of my graduate career.

References
Gordon AD, Green DJ, & Richmond BG (2008). Strong postcranial size dimorphism in Australopithecus afarensis: results from two new resampling methods for multivariate data sets with missing data. American journal of physical anthropology, 135 (3), 311-28 PMID: 18044693

Richtsmeier JT, & Lele S (1993). A coordinate-free approach to the analysis of growth patterns: models and theoretical considerations. Biological Reviews, 68 (3), 381-411 PMID: 8347767

Updated note on jaw growth in Australopithecus robustus

A few weeks ago I posted some early observations I’ve made about mandible growth in Australopithecus robustus compared with humans. My dissertation tests the null hypothesis that overall mandible growth is identical in the two species. This is complicated by the fact that there are many aspects of jaw growth (i.e. lots of variables) and not all fossils preserve the same parts. In these early preparatory stages I’m looking only at the height and width of the jaw at the second baby molar (in kids) and the second permanent premolar that replaces this baby tooth in older individuals, since this is something most of the fossils have. This work will get me ready for the hard comparisons, where the fossils aren’t so kind.

One concern I had in the earlier post was that my human sample was (and still is) fairly small, making comparisons rather tentative. Since then, I have about doubled my human sample (but I still have lots of work to do), so it’s timely to see if my earlier observations have held up. AND THEY DO!

To the right is a plot of jaw height at said tooth position across the growth period, humans being the black circles and A. robustus the thick red ones. Note that measures are standardized, taken relative to the smallest (not necessarily the youngest) individual in each sample. Before, I’d found that the two samples overlapped up to dental stage 4 (when the first permanent tooth comes in). After this point, the A. robustus jaw gets much larger through early adulthood, whereas in humans the height increase isn’t so drastic. With a larger sample, there is a bit more overlap in relative jaw height (especially early on), but the overall result is the same as I found earlier. Neat!

To the left is a similar plot, this time looking at width of the jaw across the growth period (these are also size-standardized as above, colors are the same). What’s remarkable is that the width of the human jaw is pretty much the same from infancy to adulthood. I remember thinking this when I first started looking at human jaws early last summer, but I’d never looked at how they compare with A. robustus, whose jaw continues to increase in absolute and relative width with age (and possibly even through adulthood; Lockwood et al. 2007). This plot is admittedly a bit confusing, as sizes are measured relative to the smallest and not youngest individuals, and the narrowest human jaw is in dental stage 4. The A. robustus sample also includes a very old adult (the highest point on the plot) while the human sample only goes to early adulthood. But the basic patterns are still pretty different: A. robustus jaws get wider up to dental stage 5 (you could think of it as pre- or early adolescence) then level out (not including our large older adult), but humans’ average jaw width is fairly constant throughout ontogeny. Of course, this is at only one position along the jaw, and others will probably different.

The fragmented jaws of the youngest A. robustus (i.e. SK 63 and SK 438) do not look too different from their human counterparts, but adults are very different. Here we can see part of the reason why. Bear in mind, though, that other aspects of mandible shape do differ between these species from birth. For example, humans have a bony chin from infancy, whereas A. robustus always lacks a true chin (SK 74 is an older, probably female adult A. robustus that does have a rather anomalous “chin” but it is not homologous to ours). Not all aspects of species-specific mandible shape arise during postnatal growth!

ResearchBlogging.org
But there you go, an enlarged human sample produces a result consistent with my earlier observation. Note that these pictures do not represent statistical tests of my hypothesis! Yes, a visual inspection of the plotted numbers suggests the two species differ in how jaw height and width grows. But saying something statistical and “definitive” is difficult. In terms of height, growth does seem pretty much the same during childhood, but then divergent later on. Width growth in the two species seems totally different. To further complicate things, a “shape” ratio of jaw width divided by height (not shown) suggests parallel (but not identical) growth trajectories in the two species. What do these observed differences mean for the null hypothesis? Which and how many variables can differ before I can feel confident about whether to reject the hypothesis? Oy, I have my work cut out for me. Stay tuned!

That paper I referenced
Lockwood, C., Menter, C., Moggi-Cecchi, J., & Keyser, A. (2007). Extended Male Growth in a Fossil Hominin Species Science, 318 (5855), 1443-1446 DOI: 10.1126/science.1149211

Data, development and diets

As mentioned briefly but repeatedly on this blog, my dissertation is about growth of the lower jaw in Australopithecus robustus (right), comparing it with jaw growth in recent humans. This is important because we don’t really know exactly how skeletal-dental (especially skeletal) maturation of our fossil relatives compares with us today. From a developmental perspective, it is also important to know how and when adult form arises during growth, and how these processes vary within and between species.


It’s not easy to examine ontogeny in fossil samples. In a post a few weeks ago I included a drawing of some of the A. robustus juvenile jaws. At the time, I was pointing out variation in dental maturity (which is a nice thing when studying growth), but the picture also reveals a bigger bugbear – variable preservation of features (which is a terrible thing if you’re trying to study growth).

For example, the youngest individual in the fossil sample (right, viewed from above, front is at the top of the picture) includes only the second baby molar tooth, a bit of the bone surrounding the sides and back of the tooth, and a small portion of the ascending ramus. The oldest subadult in the sample (SKW 5), on the other hand, is almost entirely complete. In between these ages, jaws variously preserve different parts. Under these circumstances (i.e. lots of missing data), growth cannot be studied by traditional (namely, multivariate) methods (how I will deal with this is a topic for another day).


So while studying the fossils in South Africa, in order to maximize the number of comparisons I could possibly make, I measured just about every single linear dimension conceivable on these jaws. I thus have a spreadsheet with 300 columns of measurements I could take on each specimen. Most of the cells are empty : (


What’s a boy to do?! In order to compare A. robustus with humans, I need to take the same measurements on a growth series of human jaws, too. But life is short, and if I want to finish this project before I succumb to some sinister signature of senescence, I really can’t take hundreds of measurements on a human sample which is much larger than the fossils. Plus, a lot of the individual measurements are a bit redundant: some of the distances overlap, many of the variables can be taken on the right and the left sides, etc.


If I am to finish collecting data in a reasonable time frame, I need to cull my variables from 300 to however many (a) maximizes the comparisons I can make within the less-complete A. robustus sample, and (b) are not too repetitive. Boo. Plus I have to get these spreadsheets ready to be read and analyzed in the program R, which for whatever reason is always a pain in the ass.

Again, the statistics of the overall comparisons is a topic for another day, and I haven’t had the opportunity yet to write the analytical program(s). But I have looked at some individual traits in A. robustus compared with a subsample of humans. For example, at the left is a plot of changes in height of the jaw at the baby second molar or adult second premolar (which replaces the baby molar). Obviously my human sample is way to small at the moment to make any really meaningful statements about how growth compares between the two species. Note also that these are absolute measures and not size-corrected, and that these are stages of dental eruption rather than chronological ages. But from this preliminary view, the two species are very similar up to around when the first adult molar comes in (“stage 4” here). Thereafter, the A. robustus individuals dramatically increase in size rather fast, whereas humans only slowly increase in size.


Again, this is a very preliminary result, and only for a single measurement. But it is interesting in light of a recent study by Megan Holmes and Christopher Ruff (2011). These researchers compared jaw growth recent humans who differed in the consistency of their diets. They found that kids in the two populations were not too different, but the samples became more different with age to become fairly different as adults. Now, A. robustus seems to have eaten a diet with lots of hard objects (see recent review by Peter Ungar and Matt Spohneimer), but humans’ diet (and technology) really obviates the need for chewing as powerful as seen in A. robustus. So this dietary divergence may well be reflected in the growth difference suggested above, but it may not be the sole factor. PLUS I NEED TO INCREASE MY HUMAN SAMPLE.


Stay tuned for more analyses and results!


ResearchBlogging.orgReferences to make you smarter and stronger
Holmes, M., & Ruff, C. (2011). Dietary effects on development of the human mandibular corpus American Journal of Physical Anthropology, 145 (4), 615-628 DOI: 10.1002/ajpa.21554


Ungar, P., & Sponheimer, M. (2011) The Diets of Early Hominins. Science 334(6053), 190-193. DOI: 10.1126/science.1207701  

Variation: a blessing and a curse

Trying to start on finishing my dissertation, I’m thinking about the issue dental development and how it relates to skeletal growth. Specifically I’m trying to decide whether I want to analyze my human and Australopithecus robustus samples based on estimates of “dental age,” or if I want to be a bit more cavalier and divide the sample into rougher age categories.

To avoid copyright issues, here’s a crappy picture I drew a few years ago, of the youngest A. robustus jaws. The youngest, “SK 438” is erupting its last baby tooth (bottom right), while the others have their full set of baby teeth, and none of them has its first adult tooth yet. I don’t think I can estimate ages accurately enough to capture the true chronological difference between SK 438 and the rest. Would I be better off just dividing the group into “younger” (SK 438) and “older” (the rest) infants, or even lumping them all together as simply “infants”?

On the one hand, I could assign individuals a chronological age based on a modern referent of known age, at similar stages of dental development. This could allow me to get more fine-scale glimpses into patterns of growth in my samples, but that’s assuming I’ve accurately estimated their ages. Individuals vary in the ages and sizes at which their teeth erupt; a person’s first molar, for example, may erupt at anywhere from 4-8 years of age. How can I estimate an individual’s age in light of such variation? And what if I’m as poor a judge of ages as Dennis Duffy?! Conceivably I could program my analysis to account for error estimation (which in itself could be educational and interesting, but is it worth the trouble?), but this would also add a further source of uncertainty. And it’s like Dwight Schrute said (Michael Scott said), “K-I-S-S: keep it simple, stupid. Great advice, hurts my feelings every time.”

On the other hand, I could divide my sample into coarse age categories – say, putting specimens who’ve attained a given level of dental development in the same group, such as ‘infant, child, juvenile, adolescent, and young adult.’ This method loses the temporal resolution of the first method, but also avoids the possible errors of assigning strict ages I’m pretty sure I would not infer accurately. But, tooth development does not show a clean 1-to-1 relationship with other systems in the body, such as hormonal axes or the bony skeleton. It’s uncertain how accurately kids can be put in any of the above categories (based on general life history variables; Bogin 1999) based on dental development.

Choices, choices.

Variation is a problem for biologists. The theory of evolution was conceived as a way to explain the conundrum of why there is such remarkable variation in the forms of life that Earth is lucky to have harbored. The problem of within-species variation in the relative timing of skeletal and dental development isn’t just a bug-bear for paleoanthropologists. It’s important to medical doctors and pathologists investigating genetically-based developmental disorders, and to epidemiologists looking at aspects of population health, such as the prevalence of growth stunting. It’s also important for forensics specialists who need to use biological clues about the age and identity of crime victims and defendants. I mean, how else would we know whether Jon Voight bit both Kramer and this pencil?

The silver lining, I suppose, on this storm-cloud of biological of variation is that without variation there cannot be evolution. And stasis is boring. If nothing changed since the Cambrian, none of us would be here today. We’d probably be some gross stupid monstrous thing, like this Hallucigenia to the right. It’s the quirks and weird variants that arise randomly, that make evolution possible. If individuals all developed exactly the same, then all organisms through all time would be the exact same, and probably all would have gone extinct as they succumbed to some sinister fate, no new variants would have arisen that may have been able to survive the devastation.

ResearchBlogging.org
So variation is a blessing and a curse. Individual and population variation make it difficult to state norms such as what is “average” or “healthy,” and nothing to be concerned about. Variation is also the magic ingredient of adaptation, without which Life could not survive the randomness inherent in any environment.

Things I cited
Bogin, B. (1999). Evolutionary perspective on human growth Annual Review of Anthropology, 28 (1), 109-153 DOI: 10.1146/annurev.anthro.28.1.109

Also 30 Rock, The Office and Seinfeld. Well done, NBC.

eFfing Fossil Friday – Renaissance and Designer Fossils

Sorry I’m a bit late on this one, and that I’ve fallen behind on keeping the blog updated. I’ve been scrambling to make all the observations on, and collect all the data from, these Australopithecus robustus mandibles in a short time. As my advisor likes to remind me, everything always takes 3x longer than you initially anticipate, and this is certainly true of my work here. Yesterday (the actual Fossil Friday), in fact, I probably spent only 30 min with these fossils. Instead, I accompanied Lee Berger and John Hawks on a trip to Malapa – the site that recently yielded fossils of the mysterious Australopithecus sediba – and other sites in the area. To get there, I rented a car and drove on the wrong side of the road for the first time – it was a trippy trip, every time I got in the car I reached to my left for a phantom seat belt, and kept searching for the gear-shift my mind thought was in the door. Nuttiness.
Anyway, I have two thoughts for this edition of eFfing Fossil Friday. First point, related to the great tour from Dr. Berger, is that a ton of hominid fossils are lying in wait for us to re-expose them to the light of day. In South Africa, the classic Plio-Pleistocene sites have been Makapansgat (A. africanus), Sterkfontein (A. africanus) and Swartkrans (A. robustus and early Homo). These sites have variously been worked since the early 20th century. Since then, a number of other hominid-bearing sites – largely in the same area as Sterkfontein and Swartkrans – have been discovered: Gladysvale, Gondolin, Drimolen, and most recently Malapa. Yet still a metric-tonne of work is still being done on the more classic sites (except maybe Makapansgat?).
View of the valley, Malapa is somewhere in the background, I think the green patch of trees near the center, just before the big hill-shadow (?).
But these sites are just the tip of a fossiliferous iceberg. A few years ago when I was working here I accompanied some other researchers on a survey for more fossil sites in the area. What I learned then is that if you look across the Sterkfontein valley in the winter, the dessicated grassland is pimpled with the occasional patch of green trees – these small verdant isles are the tells of underlying cave systems (the caves contain water that plants will cut throats for). What was driven home yesterday at Malapa and other sites Dr. Berger showed us, is that these caves are all over the place, many fossil treasure-troves. What’s more, the A. sediba discovery (and the massive hominid molars from Gondolin) points to the idea that we are only beginning to understand what hominid life was like in the past. There is a rich prehistory still waiting to be discovered in South Africa, and undoubtedly also the rest of the African continent. Human paleontological work is far from exhausted. Let us usher in a Renaissance of field Paleoanthropology!
My next thought is that the process of fossilization can make the fossil-memories of past life quite beautiful. Now, in life the enamel of teeth is white-ish (yellow/brown is also not uncommon), and bone is this off-white/yellowish color. But during the process of fossilization, the original minerals used to make the bone (and less commonly teeth) are replaced by those in the surrounding soil. Often these minerals gussy up the fossils in neat new ways – manganese for example tends to make bone/tooth black.


Check out SK 61, an infant/child Australopithecus robustus. After fossilization, this thing takes on a designer, tortoise-shell coloration (left, above). SK 12, an older adult A. robustus (right, above), is another good example: some subterranean joker has drawn a smiley face beneath his left premolar (circled). So while we are often left with a meager fossil record, at least the fragments we get are voluptuously variegated.