Dr. Yohannes Haile-Selassie & colleagues just published some amazing fossils from around 3.4 million years ago, that convincingly link an unusual hominin foot fossil to an ancient human called Australopithecus deyiremeda.
In 2012, Haile-Selassie and team reported a foot fossil from Burtele, Ethiopia, revealing a bipedal creature (like a human) but with some grasping ability in the big toe (like all other primates). Then in 2015, the team presented some jaws and teeth from a nearby geological locality in the Burtele region, around which they designated a new hominin species, Australopithecus deyiremeda. The researchers hesitated to allocate the Burtele foot to this new species since they didn’t have similar fossils for comparison between the different fossil localities. But as the scientists have recently reported, jaws and teeth discovered from the foot site, including an incredible juvenile mandible, match those of Au. deyiremeda from the nearby Burtele sites. Now we can put a foot to the name.
The Burtele fossils help reveal the diversity of early hominins like Australopithecus and the contexts out of which our own genus Homo evolved. What caught my attention hiding among this amazing assemblage was a fossil that only gets a quick mention in the paper—the ischium bone from the hip of a juvenile deyiremeda:
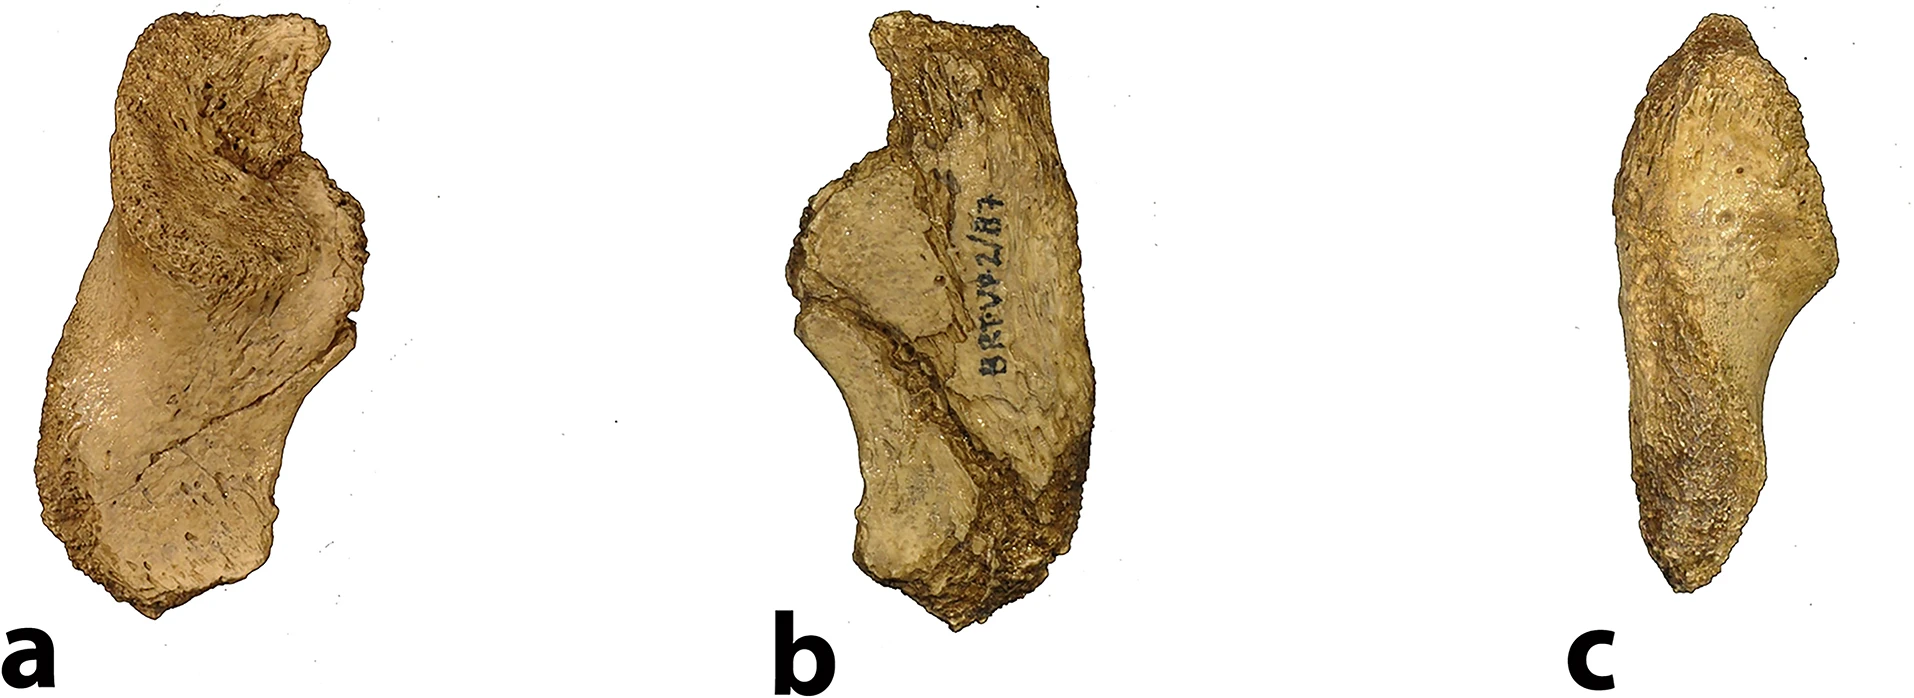
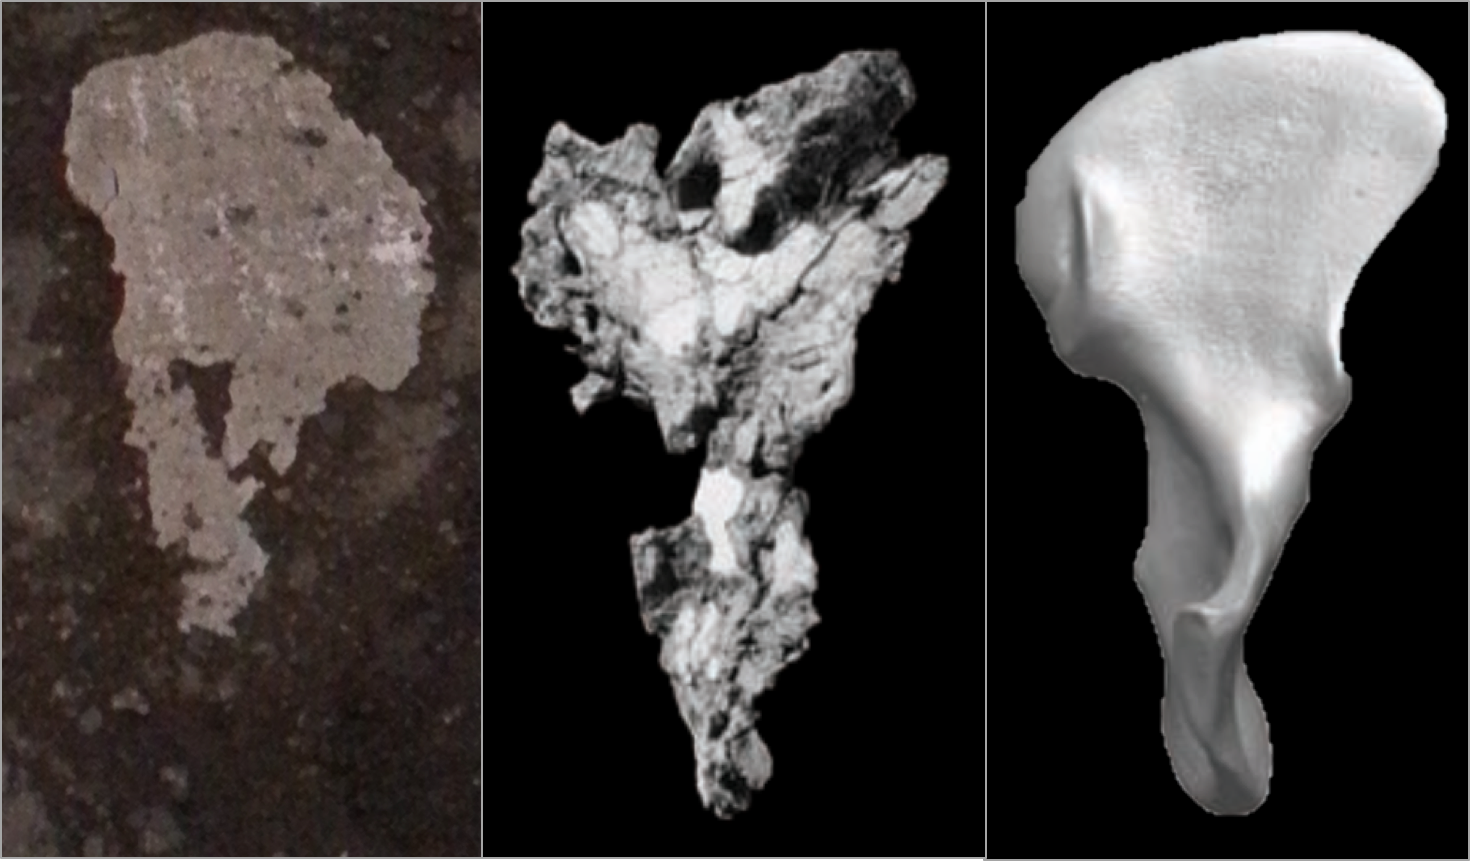
The fossil, given the catalog number BRT-VP-2/87, represents a different individual from the juvenile jaw mentioned above. It nevertheless provides a great deal of information despite being a small fragment (less than 2 inches long). The authors observe that the body of the ischium that extends beneath the hip joint is quite long, similar to modern apes, fossil Ardipithecus ramidus, and australopiths. This contrasts with the ischium of modern and fossil Homo in which the bone projects less beyond the hip socket:

The bottom of the ischium is called the “ischial tuberosity,” and is the attachment surface for the hamstrings muscles. Having a long ischium provides the hamstrings of apes and other arboreal primates with more powerful hip extension—very useful when climbing trees but it also limits how far back the thigh can extend away from the body (Kozma et al., 2018). The shorter ischium of humans, Homo naledi, and other members of our genus may make our hamstrings a little less powerful, but it also helps us fully extend our legs which is crucial to our efficient bipedal walking and running.
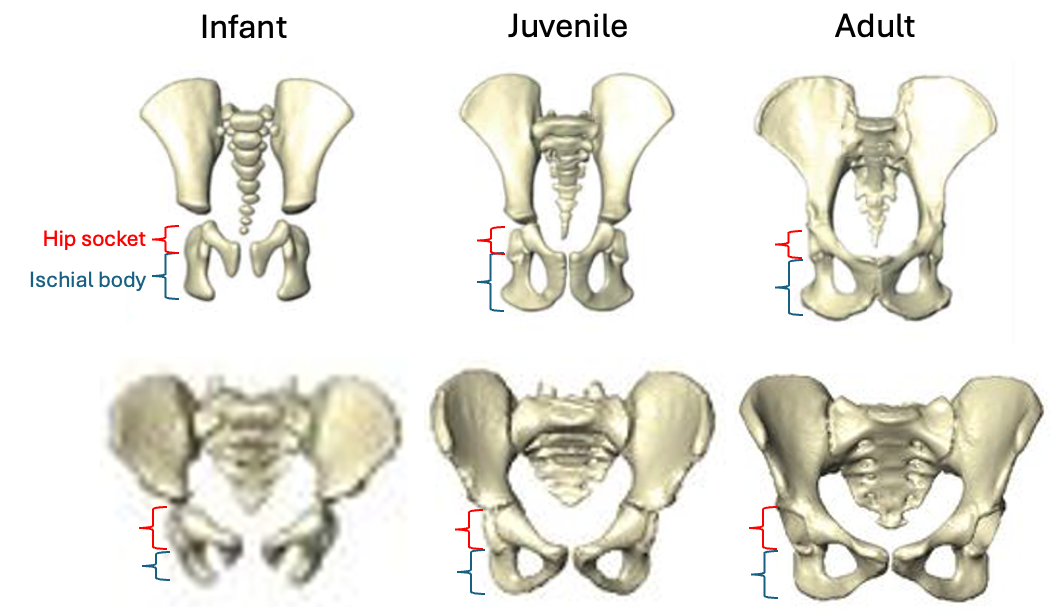
Based on studies of modern humans and other primates, we know that this configuration of bones and muscles is established before birth, so we can be confident that adult Au. deyiremeda would have had a similar anatomy to BRT-VP-2/73, albeit at an unknown, larger size. A hip well adapted for climbing is consistent with the Burtele foot with a grasping big toe.
As Haile-Selassie and colleagues note in the online supplementary information accompanying the paper, only immature fossils allow us to reconstruct the evolution of growth and development. But one of the major challenges of studying immature remains is determining their age or state of maturation, which is critical for understanding how much change occurs between, say, infancy and adulthood. The authors of this study note that the qualitative appearance of the BRT-VP-2/73 hip socket surface is like that of modern humans around 6 years of age, yet the fossil is much smaller and more similar in size to 3 year-old humans. My colleagues and I (2022) faced a similar challenge when analyzing a juvenile Homo naledi hip, and we also relied on qualitative comparisons of how the joint “looks” at different stages of development.
But I think we’re at a point now where we can try to quantify some of these tricky developing surfaces to help place immature fossils more precisely along a timeline of development. For example, Peter Stamos & Tim Weaver (2020) adapted a method for quantifying the topography of teeth, to measure the complex curvature of the developing surface of the knee. If these quantitative methods can distinguish different phases of development in large samples of humans and other primates (e.g., Stamos et al., 2025), they could then be extended to the immature hominin fossil record.
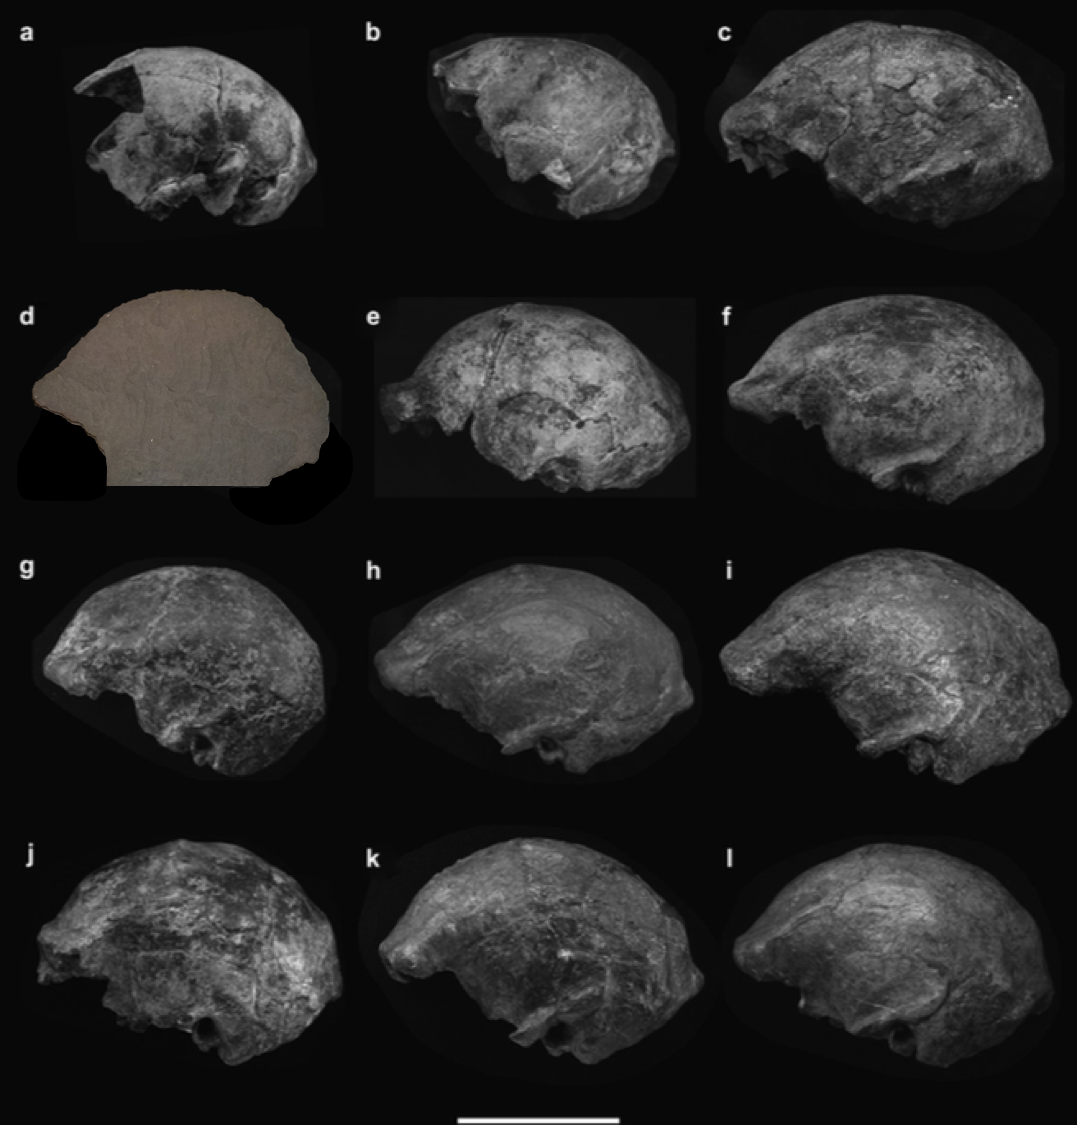
Some cool insights could also be gained by applying older and established methods like landmark-based geometric morphometrics, even on quite fragmentary fossils. This approach could capture the development and orientation of the ischial tuberosity relative to the hip socket surface in fragments like BRT-VP-2/73, MLD 8, and Homo naledi fossils (depicted above) and compared with fossil adults. Researchers have also devised robust ways of quantifying size and shape changes during growth based on modern animals, and using these patterns to then ‘grow’ immature fossils to more developed states, for comparison with actual adult fossils (McNulty et al., 2006). Applying this approach to even just the small fossil sample of ischia described here could tell us a lot about how ancient animals moved at different periods in their lives. Someone just needs to park their ischial tuberosities in a chair and do it!
A growing fossil record of immature hominins, alongside technical advances in quantifying and comparing anatomy, mean that we are ready to learn much more about how our extinct ancestors and cousins grew into competent adults.