What do brain endocasts tell us?

What makes the human brain special, and how did it change throughout our evolutionary history? One way to answer this question by comparing actual brains or MRI scans of living animals. But only fossils can show what changed and when over the past several million years, and sadly brains are basically an elaborately congealed soup that doesn’t stay fresh upon death, so they never fossilize. Happily, though, bones can preserve for millions of years, and they are literally molded by their soft and squishy surroundings. As the brain grows, it pushes outward against the inner surface of the skull, which can save the scars of the submerged cerebrum: nerds like me call these impressions an “endocast.”

Endocasts of Homo naledi (pink) and Homo erectus (yellow). Fossils are viewed from the left side and are variably preserved.

Nicole Labra and Antoine Balzeau have led a cool study, hot off the press, examining what such endocasts can tell us about the underlying brain anatomy. Importantly, they show how difficult it is to clearly and consistently identify many brainy boundaries. This is very salient in ‘paleoneurology,’ the study of brain evolution especially based off endocasts: the problem probably best illustrated by the nearly century-long debate about the natural endcoast of the “Taung child” fossil (Australopithecus africanus).

Labra & colleagues used a clever approach to address this paleontological and epistemological problem. They first generated an endocast directly associated with its brain from an MRI scan of a living human, allowing them see precisely where specific brain folds (“sulci”) lay relative to the endocast surface. They then asked a bunch of researchers—myself included—to try to identify sulci on the endocast, and then looked at how our responses compared to both one another’s and to the actual, known sulcus positions.

Figure 1 from Labra et al. (in press) showing how the brain and endocast were obtained and analyzed.

Their analysis showed that we varied quite a bit in our identifications on the endocast. As Emiliano Bruner (who also participated) discusses in his blog post, we tended to identify the stronger impressions toward the bottom and sides of the endocast better and more consistently. Some of this variability and uncertainty among researchers is due to the faintness and incompleteness of many brain impressions, and some due to biased expectations about where a given sulcus “should” be based on our previous experiences and published references.

When Antoine Balzeau first contacted me about this project, I was just beginning to dabble in “paleoneurology,” learning some brain anatomy for the first time for a description of an old Australopithecus endocast called “MLD 3.” I initially thought MLD 3 would be a quick and simple study—boy was I spectacularly disappointed!

Figure 3 from Cofran et al. 2023, comparing two different chimpanzee brains, and two corresponding interpretations of the MLD 3 endocast.

Probably reflecting observer bias and desire for definitive results, we initially interpreted the endocast impressions on MLD 3 as representing a ‘human-like’ anatomy that is super rare in living chimpanzees (namely the “LS” depicted in the right half of the figure above). The researchers who peer-reviewed the first draft of our paper, though, suggested we to be more cautious in our interpretations; one reviewer outright disagreed with us in support of a more ‘ape-like’ interpretation (left half of the figure above). The review process alone underscored the subjectivity and uncertainty in analyzing endocasts. In the end we presented both interpretations, and I honestly don’t know which (if either) is most likely to be correct. So the study by Labra and colleagues provides a nice empirical illustration of this cranial conundrum.

Fortunately, researchers are developing methods to help identify brain structures on endocasts. Jean Dumoncel, Edwin de Jager, and Amélie Beaudet among others have done some really impressive work looking at variability in both brains (for instance here) and endocasts (for instance here). By using computer-based 3D data and methods, these researchers have shown where many brain sulci tend to be located (see here). By developing a better understanding of variation in where sulci sit on an endocast, we can have a better idea of which sulci might be represented on fossil endocasts, which in turn can tell us about the brains of our extinct relatives. Edwin and Amélie presented a very cool new analysis of Australopithecus/Paranthropus boisei endocasts, building off this digital approach, at the recent ESHE conference. And as noted in our MLD 3 paper, I think machine learning and other ‘artificial intelligence’ approaches could also help us identify ambiguous features from frustrating fossil fragments.

Dietary divergence of robust australopithecines

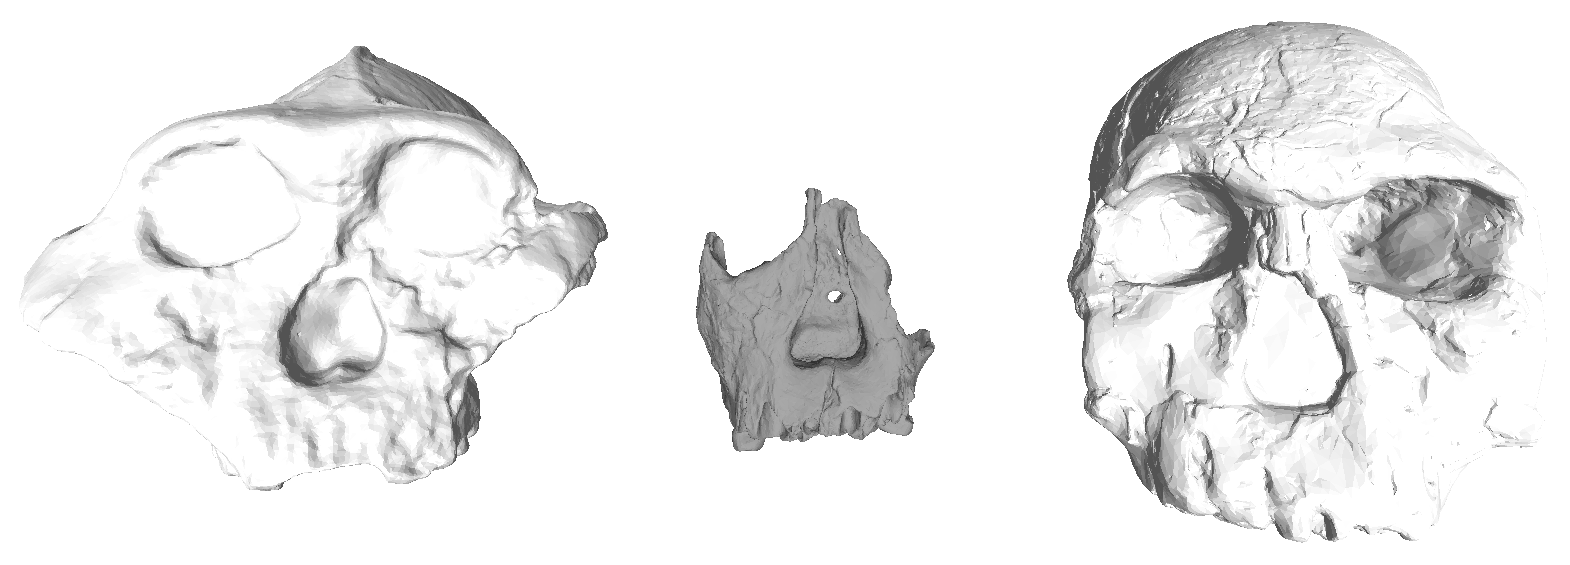
I’m writing a review of the “robust” australopithecines, and I’m reminded of how drastically our understanding of these hominins has changed in just the past decade. Functional interpretations of the skull initially led to the common wisdom that these animals ate lots of hard foods, and had the jaws and teeth to cash the checks written by their diets.

Screen Shot 2016-07-28 at 9.28.43 AM

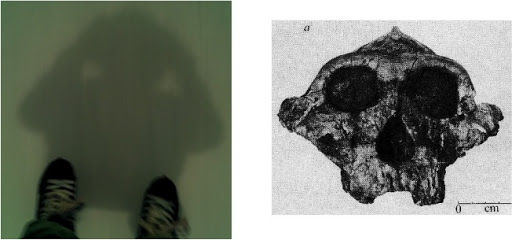
Comparison of a “gracile” (left) and “robust” (right) Australopithecus face, from Robinson (1954).

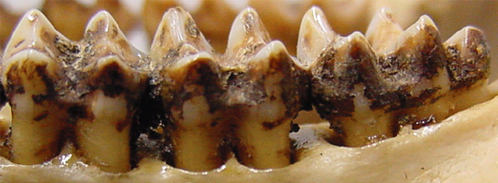
While anatomy provides evidence of what an animal could have been eating, there is more direct evidence of what animals actually did eat. Microscopic wear on teeth reflects what kinds of things made their way into an animal’s mouth, presumably as food, and so provide a rough idea of what kinds of foods an animal ate in the days before it died. Microwear studies of A. robustus from South Africa had confirmed previous wisdom: larger pits and more wear complexity in A. robustus than in the earlier, “gracile” A. africanus suggested more hard objects in the robust diet (e.g., Scott et al., 2005). A big shock came a mere 8 years ago with microwear data for the East African “hyper robust” A. boisei: molars had many parallel scratches and practically no pitting, suggesting of a highly vegetative diet (Ungar et al. 2008).

robust microwear

Microwear in A. boisei (blue) and A. robustus (red). Although they overlap mostly for anisotropy (y-axis), they are completely distinct for complexity (x-axis). Data from Grine et al. (2012) and skull diagrams from Kimbel et al. (2004).

Stable carbon isotope analysis, which assesses what kinds of plant-stuffs were prominent in the diet when skeletal tissues (e.g. teeth) formed, further showed that the two classically “robust” hominins (and the older, less known A. aethiopicus) ate different foods. Whereas A. robustus had the carbon isotope signature of an ecological generalist, A. boisei had values very similar to gelada monkeys who eat a ton of grass/sedge. GRASS!

robust isotopes

Stable carbon isotope data for robust australopithecines. Data from Cerling et al. (2013) and skull diagrams from Kimbel et al. (2004). Note again the complete distinction between A. robustus (red) and A. boisei (blue).

ResearchBlogging.orgWhile microwear and isotopes don’t tell us exactly what extinct animals ate, they nevertheless are much more precise than functional anatomy and help narrow down what these animals ate and how they used their environments. This highlights the importance of using multiple lines of evidence (anatomical, microscopic, chemical) to understand life and ecology of our ancient relatives.

REFERENCES

Cerling TE, Manthi FK, Mbua EN, Leakey LN, Leakey MG, Leakey RE, Brown FH, Grine FE, Hart JA, Kaleme P, Roche H, Uno KT, & Wood BA (2013). Stable isotope-based diet reconstructions of Turkana Basin hominins. Proceedings of the National Academy of Sciences, 110 (26), 10501-6 PMID: 23733966

Grine FE, Sponheimer M, Ungar PS, Lee-Thorp J, & Teaford MF (2012). Dental microwear and stable isotopes inform the paleoecology of extinct hominins. American Journal of Physical Anthropology, 148 (2), 285-317 PMID: 22610903

Kimbel WH, Rak Y, & Johanson DC (2004). The Skull of Australopithecus afarensis. Oxford University Press.

Robinson, J. (1954). Prehominid Dentition and Hominid Evolution Evolution, 8 (4) DOI: 10.2307/2405779

Ungar PS, Grine FE, & Teaford MF (2008). Dental microwear and diet of the Plio-Pleistocene hominin Paranthropus boisei. PloS One, 3 (4) PMID: 18446200

Bioanthro lab activity: Hominin brain size

Last week in my Human Evolution class we looked at whether we could estimate hominin brain sizes, or endocranial volumes (ECV), based on just the length and width of the bony brain case. Students took these measurements on 3D surface scans…

Maximum cranial length in Australopithecus boisei specimen KNM-ER 406.

Maximum cranial length in Australopithecus boisei specimen KNM-ER 406.

… and then plugged their data into equations relating these measurements to brain size in chimpanzees (Neubauer et al., 2012) and humans (Coqueugniot and Hublin, 2012).

The relationship between cranial length (x axis) and ECV (y axis).

The relationship between cranial length (x axis) and ECV (y axis). Left shows the chimpanzee regression (modified from Fig. 2 in Neubauer et al., 2012), while the right plot is humans (from the Supplementary Materials of Coqueugniot and Hublin, 2012).

So in addition to spending time with fossils, students also learned about osteometric landmarks with fun names like “glabella” and “opisthocranion.” More importantly, students compared their estimates with published endocranial volumes for these specimens, based on endocast measurements:

Human and chimpanzee regression equations don't do great at estimating hominin brain sizes.

Human and chimpanzee regression equations don’t do great at predicting hominin brain sizes. Each point is a hominin fossil, the x value depicting its directly-measured endocranial volume and the y value its estimated volume based on different regression equations. Black and red points are estimates based on chimpanzee cranial width and length, respectively, while green and blue points are based on human width and length, respectively. The dashed line shows y=x, or a correct estimate.

This comparison highlights the point that regression equations might not be appropriate outside of the samples on which they are developed. Here, estimates based on the relationship between cranial dimensions and brain size in chimpanzees tend to underestimate fossils’ actual values (black and red in the plot above), while the human regressions tend to overestimate hominins’ brain sizes. Students must think about why these equations perform poorly on fossil hominins.

Most of the fossil scans come from AfricanFossils.org, but a few are from Artec’s sample gallery. One of the cool, fairly recent humans at African Fossils (KNM ER 5306) will give students something else to think about:

"Why doesn't this look like the rest of the human crania we've seen this semester?"

“Why doesn’t this look like the rest of the human crania we’ve seen this semester?”

Here are the lab materials so you can use and adapt this for your own class:

Lab 4-Brain size (Instructions & questions)

Lab 4 data table (with equations)

ResearchBlogging.orgReferences
Coqueugniot, H., & Hublin, J. (2012). Age-related changes of digital endocranial volume during human ontogeny: Results from an osteological reference collection American Journal of Physical Anthropology, 147 (2), 312-318 DOI: 10.1002/ajpa.21655

Neubauer, S., Gunz, P., Schwarz, U., Hublin, J., & Boesch, C. (2012). Brief communication: Endocranial volumes in an ontogenetic sample of chimpanzees from the taï forest national park, ivory coast American Journal of Physical Anthropology, 147 (2), 319-325 DOI: 10.1002/ajpa.21641

Bioanthro lab activity: What species is it?

We’re learning about the divergence between robust Australopithecus and early Homo 2.5-ish million years ago in my Human Evolution class this week. Because of this multiplicity of contemporaneous species, when scientists find new hominin fossils in Early Pleistocene sites, a preliminary question is, “What species is it?”

Screen Shot 2015-10-30 at 10.42.22 AM

Scrutinizing the fossil record, asking the difficult questions. (Science credit)

To help my students learn how we know whether certain fossils belong to the same species, and to which group new fossils might belong, in this week’s lab we compared tooth sizes of Australopithecus boisei and early Homo. After seeing how tooth sizes differed between these groups, students then tested whether they could determine whether two “mystery” fossils (KNM-ER 60000 and 62000; Leakey et al. 2012) belonged either group.

Early Pleistocene hominin fossils from Kenya. Left to right: KNM-ER 406, ER 62000 and ER 1470.

Early Pleistocene hominin fossils from Kenya. Left to right: KNM-ER 406, ER 62000 and ER 1470. At the center is one f the lab’s “mystery jaws.”

Students downloaded 3D scans of hominin fossils from AfricanFossils.org, and measured buccolingual/labiolingual tooth crown diameters using MeshLab.

Early Pleistocene hominin mandibles. Left to right: KNM-ER 3230, ER 60000 ("mystery" jaw) and ER 1802.

Early Pleistocene hominin mandibles. Left to right: KNM-ER 3230, ER 60000 (“mystery” jaw) and ER 1802.

The first purpose of this lab was to help familiarize students with skull and tooth anatomy of early Pleistocene humans. Although lectures and readings are full of images, a lab activity forces students to spend time visually examining fossils. Plus, they’re in 3D which is a whole D greater than 2D – the visual equivalent of going to eleven! The second goal of the lab was to help prepare students for their term projects, in which they must pose a research question about human evolution, generate predictions, and find and use data to test hypotheses.

If you’re interested in using or adapting this activity for your class, here are the handout and data sheet into which students enter their measurements. The data sheet specifies the fossils that can be downloaded from africanfossils.org.  Some relevant fossils (i.e., KNM WT 15000 and ER 992) were not included because the 3D scans yield larger measurements than in reality.

Lab 3-Mystery Jaws (instructions and questions)

Lab 3-Mystery jaws data sheet

ResearchBlogging.orgReference
Leakey MG, Spoor F, Dean MC, Feibel CS, Antón SC, Kiarie C, & Leakey LN (2012). New fossils from Koobi Fora in northern Kenya confirm taxonomic diversity in early Homo. Nature, 488 (7410), 201-4 PMID: 22874966

Gracile & robust Australopithecus

Last week, I introduced my Human Evolution students to the “robust” australopithecines. It was a very delicate time, when we had to have a grown up, mature conversation about adult things. I reminded the students that they’re only human, but they must resist urges that seem only natural. No matter how much they want to, even if their friends are doing it, they must not act on the deep, dark desire to say that “robust” vs. “gracile” Australopithecus differ in their body build.

Don't do it, Homo naledi. Don't talk about body size when you mean to talk about jaw and tooth size. Illustration by Flos Vingerhoets.

Don’t do it, Homo naledi. Don’t talk about body size when you mean to talk about jaw and tooth size. Illustration by Flos Vingerhoets.

Every semester, students (who don’t read and/or pay attention to lecture) think that the difference between these two groups has to do with the species’ body sizes. This is a misconception that has reached the highest echelons of reference:

At least one person is not citing their source here. F-.

Apple and Google, at least one person here is not citing their source: F-. Also, is no one else surprised that this term is allegedly specific to anthropology?

No. In the case of australopiths, “gracile” and “robust” refer to the relative size of the jaws, teeth and chewing muscles (all contributing to the “masticatory apparatus”). Traditionally,  graciles include the ≥2 million year old Australopithecus afarensis and africanus, and robusts include the later A. boisei and robustus. The discovery of an A. aethiopicus cranium (Walker et al. 1986) somewhat blurred the lines between the two groups but it is usually included with the robusts (who are often collectively called Paranthropus). John Fleagle’s classic textbook (1999) illustrates the gracile-robust dichotomy very nicely:

Comparison of gracile (left) and robust (right) craniodental traits. From Fleagle, 1999.

So to recap: Jaws and teeth, people! To the best of my knowledge, there’s little or no evidence that the various australopithecines differed appreciably in body size (McHenry and Coffing, 2000), stoutness, or muscularity. Although the OH 80 partial skeleton, attributed to Australopithecus boisei  based on tooth size and proportions, includes a humerus with very thick cortical bone and a radius with a crazy big insertion for the biceps muscle – it was a very large and muscular A. boisei (Domínguez-Rodrigo et al., 2013). Nevertheless, gracile and robust australopithecine species differ most notably in their jaws and teeth, not bodies. Maybe this is why Liz Lemon was so confused about the term “robust”?

Today, these are somewhat antiquated terms. Back when the only hominins known to science were the species listed above, it was easy to make a distinction. However, as the fossil record has expanded of late, the gracile-robust dichotomy becomes blurry. Australopithecus garhi (Asfaw et al., 1999) has overall tooth proportions comparable to graciles, but absolute tooth sizes and sagittal cresting like robusts. The recently described Australopithecus deyiremeda has tooth sizes and proportions like graciles but lower jaws that are very thick, like those of robust australopithecines (Haile-Selassie et al., 2015).

So in light of all the confusion and blurring distinctions, maybe it’s time to scrap “gracile” vs. “robust”?

Further reading:  The “robust” australopiths (Constantino, 2013), I also wrote up a short reference chapter here.

ResearchBlogging.org

References
Asfaw B, White T, Lovejoy O, Latimer B, Simpson S, & Suwa G (1999). Australopithecus garhi: a new species of early hominid from Ethiopia. Science (New York, N.Y.), 284 (5414), 629-35 PMID: 10213683

Domínguez-Rodrigo, M., Pickering, T., Baquedano, E., Mabulla, A., Mark, D., Musiba, C., Bunn, H., Uribelarrea, D., Smith, V., Diez-Martin, F., Pérez-González, A., Sánchez, P., Santonja, M., Barboni, D., Gidna, A., Ashley, G., Yravedra, J., Heaton, J., & Arriaza, M. (2013). First Partial Skeleton of a 1.34-Million-Year-Old Paranthropus boisei from Bed II, Olduvai Gorge, Tanzania PLoS ONE, 8 (12) DOI: 10.1371/journal.pone.0080347

Haile-Selassie Y, Gibert L, Melillo SM, Ryan TM, Alene M, Deino A, Levin NE, Scott G, & Saylor BZ (2015). New species from Ethiopia further expands Middle Pliocene hominin diversity. Nature, 521 (7553), 483-8 PMID: 26017448

Walker, A., Leakey, R., Harris, J., & Brown, F. (1986). 2.5-Myr Australopithecus boisei from west of Lake Turkana, Kenya Nature, 322 (6079), 517-522 DOI: 10.1038/322517a0

Virtual paleontology activity

Last week Nazarbayev University hosted an Instructional Technology Showcase, in which professors demonstrated some of the ways we use technology in the classroom. This was the perfect venue to show off the sweet skeletal stuff we study in Biological Anthropology, through the use of pretty “virtual” fossils. In the past year I’ve started using CT and laser scans of skeletal remains to make lab activities in a few classes (I’ve posted two here and here). Such virtual specimens are especially useful since it is hard to get skeletal materials and casts of fossils here in the middle of the Steppe. These scans are pretty accurate, and what’s more, 3D printing technology has advanced such that physical copies of surface scans can be created from these virtual models. So for the Showcase, I had a table where passersby could try their hand at measuring fossils both in hand and in silico.

Lower jaw of an infant Australopithecus boisei (KNM ER 1477). Left is the plastic cast printed from the laser scan on the right.

Lower jaw of an infant Australopithecus boisei (KNM ER 1477). Left is the plastic cast printed from the laser scan on the right.

The Robotics Department over in the School of Science and Technology was kind enough to print out two fossils: KNM ER 1477, an infant Australopithecus boisei mandible, and KNM KP 271 a distal humerus of Australopithecus anamensis. They used a UP Plus 2 printer, a small desktop printer that basically stacks layers of melted plastic to create 3D models; they said it took about 9 hours to print the pair. Before the Showcase, I measured the computer and printed models on my own for comparison with published measurements taken on the original fossils (KP 271 from Patterson and Howells, 1967; ER 1477 from Wood, 1991). The virtual fossils were measured using the free program Meshlab, while basic sliding calipers were used to measure the printed casts.

I was pleasantly surprised at how similar my measurements were to the published values (usually within 0.1 mm), since it means that the free fossil scans provided by the National Museums of Kenya are useful not only for teaching, but potentially also for research.

The Virtual Paleontology Lab

The Virtual Paleontology Lab. The Kanapoi distal humerus is held in the foreground while the A. bosei jaw rests on the table. Yes, those are real palm trees.

Knowing that these models are pretty true to life (well, true to death, since they’re fossils), I was curious how students, faculty and staff would do. I picked two fairly simple measurements for each fossil. None of the people that came by to participate had any experience with bones or fossils, or measuring these in person or on a computer. Here are their results:

Boxplots showing participants' data, for two measurements on each of the fossils. The blue stars mark the published values. The red rugs on either side indicate measurements taken on the scans (left side) or printed casts (right).

Boxplots showing participants’ data, for two measurements on each of the fossils. The blue stars mark the published values. The red rugs on either side indicate measurements taken on the scans (left side) or printed casts (right).

For the most part, the inexperienced participants’ measurements are not too far off from the published values. There’s not really an apparent tendency for either cast or computer measurements to be more accurate, although measurements of the Kanapoi humerus are closer than the computer measurements (third and fourth boxes above). In my personal opinion, nothing beats handling fossils (or casts of them) directly, but this little activity suggests students can still make reliable observations using 3D scans on a computer.

Sweet free stuff:
Meshlab software
3D scans of fossils from the National Museums of Kenya

Australopithecus boisei bites

I always wondered what our extinct relative, Australopithecus boisei tasted like, until I moved to Kazakhstan.

2015-03-11 21.38.26

Mini calotte, or manti?

Here, dumplings with various fillings are called “manti” and usually have a distinct crimping running across the top. Along with their broad flaring bases and dome-like shapes, this gives manti the appearance of miniature A. boisei brain cases replete with sagittal crests:

They all look so delicious!

They all look so delicious! Fillings from left to right: lamb, pumpkin+lamb, mushrooms ewwwww.

In case you had trouble discerning braincase from блюдо, calotte from закуски in the pic, check out africanfossils.org and see if their handy, free 3D scans of fossils OH 5 and ER 406 help you figure it out.

eFfing #FossilFriday: Subfossil lemurs

Hard to resist the headline, “Enormous underwater fossil graveyard found,” from the National Science Foundation. The NSF posts a video detailing the discovery of an underwater cave system containing “hundreds of potentially 1,000-year-old [lemur] skeletons…” in Madagascar. As a paleontologist, hearing about the discovery large numbers of ancient skeletons is musical, like hearing Love This Giant or the new T Swift for the first time.

Two lemur crania in an underwater cave on Madagascar. Photo from nbcnews.com.

Two lemur crania in an underwater cave on Madagascar. Photo from nbcnews.com.

It’s a pretty remarkable discovery – hundreds if not thousands of bones representing many complete skeletons of various extinct lemur species. And toward the end of the clip is a skull of a pretty badass looking big cat. The video shows piles of loose bones dredged up from the cave. These will reveal lots of information about the biology of these recently extinct animals, especially if researchers can keep associated bones together.

So what are these animals? Lemurs are one of the most primitive living types of primates – although they are relatively closely related to us humans, they retain many characteristics of ancestral mammals. I know it’s hard to believe this aye-aye here is more closely related to you than to rodents, but it is:

An aye-aye (Daubentonia madagascarensis) using its narrow and elongated middle finger to fish for for grubs inside a tree that it’s opened up with its teeth.

Lemurs are found only on the island of Madagascar, and over the past several millions of years they have diversified into the roughly 100 species inhabiting the island today. But even just a few thousand years ago, there were more kinds of lemurs. This includes Megaladapis, the large-bodied “koala lemur,” and Hadropithecus, whose skull bears a striking resemblance to the extinct hominin Australopithecus boisei. As  Laurie Godfrey says in the video, “two thirds of the animals that lived there only a thousand years ago are gone.” Humans are probably largely responsible for the extinction of many Malagasy lemurs in both the past and especially the present.

Much of the ‘fossil’ record for lemurs is recent by fossil standards, and so most specimens haven’t become fully fossilized. As a result, lemur paleontology is besprinkled with the term “subfossil,” indicating bones that are really old and belong to extinct animals, but don’t fit the technical definition of fossils. The lemur subfossil record has taught us a lot about the evolutionary history, adaptations, and recently even genetics of this primitive group of primates, as well as about the ecological history of Madagascar. It will be very interesting to see what new insights will come from the recently discovered scores of underwater skeletons.

OH NO IT’S HADROPITHECUS

(Figure 3 from Ryan et al., 2008. Scale bar is 1 cm)

Osteology everywhere: Muffin tops

It’s become challengingly chilly here in Astana and my days of running outdoors are fading into memories redshifting into oblivion, so last weekend I went ice skating instead. Pulling off certifiably Scott Hamiltonian moves, I espy my silhouette and what hominid face is staring back?

That’s, right, Australopithecus boisei (right). Of course they’re not identical, but then they don’t really have to be when you see Osteology Everywhere.

But then again, when you’ve been doing this too long, you start to see Paleontology Everywhere, too. The shadow also reminded me of a time a few years ago, when we were picking through bags of backdirt at Dmanisi, foraging for micromammals, passing pachmelia and time with trivia. Someone posed the riddle, “What did one muffin say to the other muffin?” To which I responded:

Historical contingency and an herbivorous calamity

This post was chosen as an Editor's Selection for ResearchBlogging.org

A while ago I asked, “What the hell was Australopithecus boisei doing?” To recap: there’s this weird side branch of human evolution that was dubbed “Australopithecus boisei” and lived in Eastern Africa from around 2.3 – 1.4 million years ago. They lived right alongside our ancestors, early Homo. If you think human diversity is remarkable today, you’d be totally blown away by the diversity of the early Pleistocene. Since 1959 when A. boisei (then Zinjanthropus boisei) was first discovered, people noticed its massive molar and premolar teeth, thick and powerful jaws, and muscle markings indicative of diabolical chewing power. ‘Probably subsisted on a diet of low-quality, hard to chew foods,’ people reasoned.

But a few years ago, this picture changed: evidence from toothwear and the chemical composition of teeth suggested A. boisei was actually eating grass or sedges (see the referred post or a nice recent review by Julia Lee-Thorp for more info). Such a diet is totally at odds with what people had hypothesized based on the size of the chewing muscles and teeth.

Colobus molars, good for shearing apart leaves. (image: http://bit.ly/xefm6t)

I was discussing this last point with a colleague the other day, who could not believe A. boisei ate grasses or the like: Many animals known to eat grass or leaves tend have molars with high crowns with slicing edges for shearing apart a mouthful of vegetation (above), but A. boisei molars are large and low-cusped, becoming fairly flat with wear (below).

Australopithecus boisei specimen KNM-ER 15930 (Leakey & Walker 1988, Figure 8)
But, it occurred to me, maybe high-crowned, shearing molars simply were not an ‘option’ in the evolution of Australopithecus boisei. Natural selection is a powerful force of evolution, but it is limited because it can work only with existing variation: it does the best it can with what it’s got. The earliest surefire hominins, Australopithecus anamensis and afarensis, certainly did not have ‘cresty’ molars with pointy cusps, and neither did many late Miocene apes, for that matter. Rather, the ancestors of A. boisei had fairly low bulbous molar cusps, and that’s some serious evolutionary baggage for a hominid hoping to corner the grass and sedge market.
So we can draw up the following hypothesis for the evolution of A. boisei: as the early members of the species moved into a niche of eating grass/sedges, rather than evolve cresty teeth, they increased the size and enamel thickness of their ancestors’ molars to better-withstand their diet. Perhaps this was the ‘easiest’ solution to adapting teeth to a crappy diet (maybe some developmental constraint?). Or perhaps there’s another, yet unidentified food responsible for the species’ curiously high-C4 diet … who knows? Nota bene: this isn’t necessarily what I think happened, it’s just a hypothesis consistent with current evidence about A. boisei‘s anatomy and diet.
If Life on Earth has taught us anything, it’s that there are many ways to do the same thing. What’s more, evolution is highly constrained by pre-existing biology and historical circumstance. Australopithecus boisei may have been ‘a victim of its times,’ forced into an herbivorous niche for which it was ill-equipped.
READ MORE!
Leakey RE, & Walker A (1988). New Australopithecus boisei specimens from east and west Lake Turkana, Kenya. American Journal of Physical Anthropology, 76 (1), 1-24 PMID: 3136654
Lee-Thorp, J. (2011). The demise of “Nutcracker Man” Proceedings of the National Academy of Sciences, 108 (23), 9319-9320 DOI: 10.1073/pnas.1105808108
*Edited 07 Nov 2015