Mind the gaps, mend the gaps

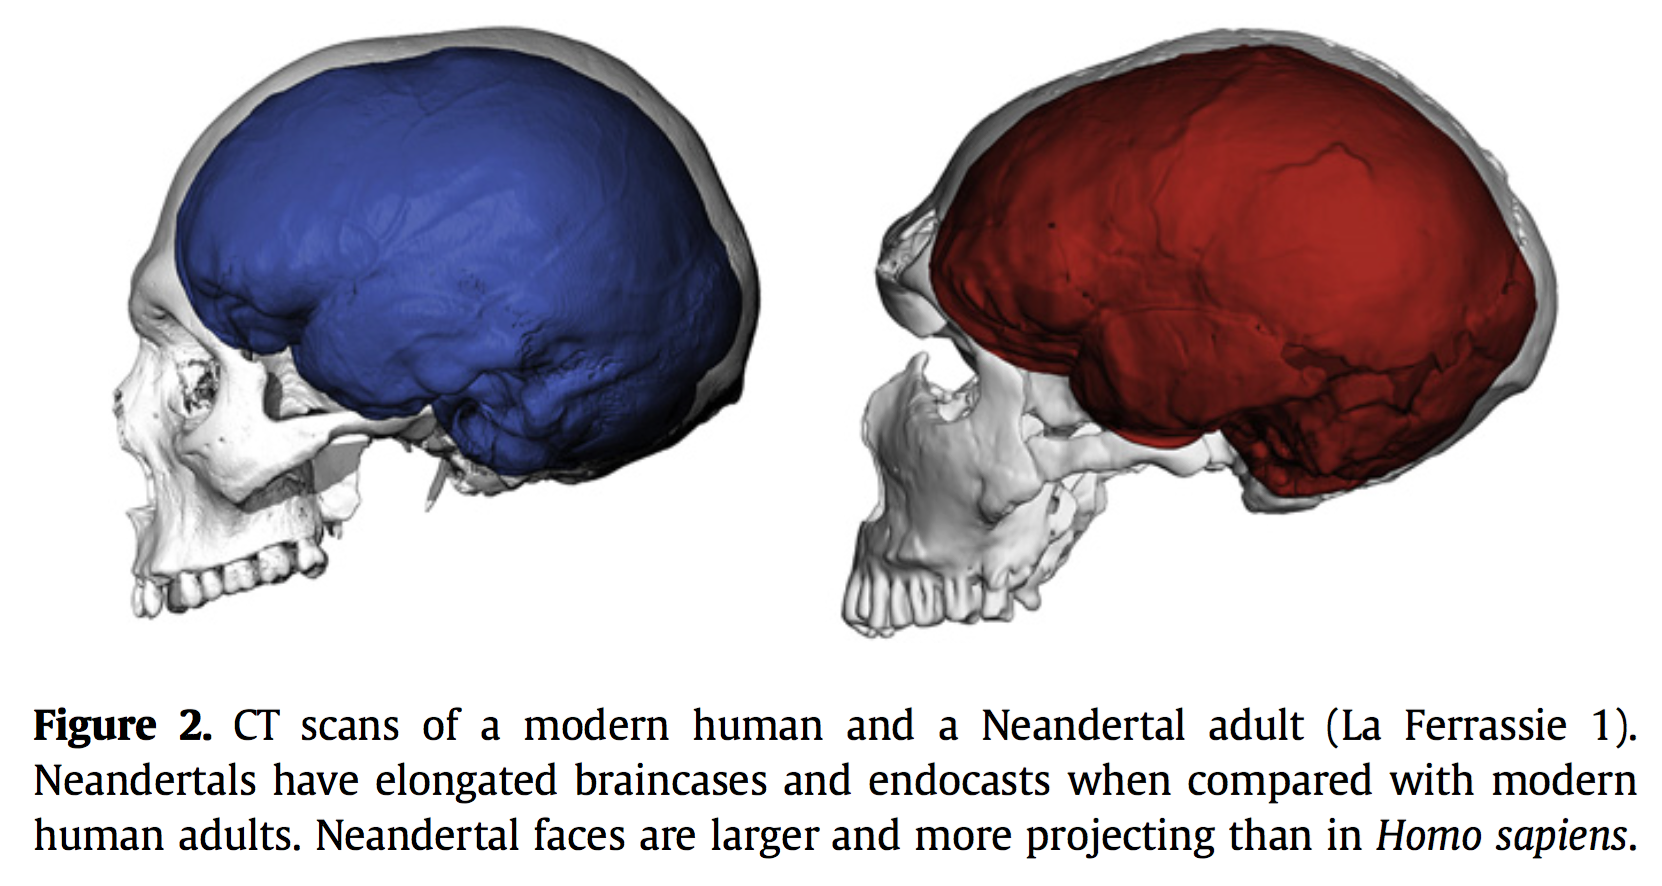
A very long time ago I asked whether Neandertals’ brains grew like ours do today, a question raised by conflicting results coming from two research teams. Both teams reconstructed the brain endocasts of modern humans and fossil Neandertals, and compared how endocast shapes changed during growth and development. As I mused in that post, the different results seem to result largely from differences in how a critical fossil specimen (the Neandertal newborn from Mezmaiskaya, Russia) was reconstructed.

Physical reconstruction of a Homo erectus cranium (A and turquoise in C) compared to its “virtual” reconstruction (B and gray in C), by Karen Baab (2025).

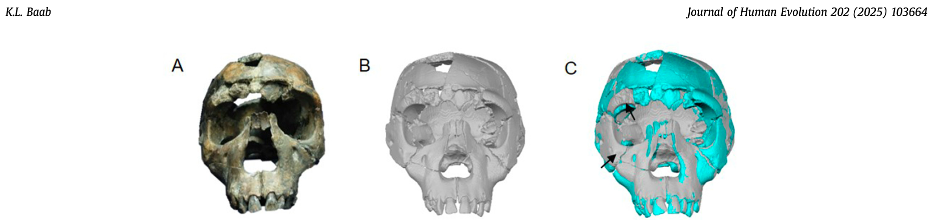
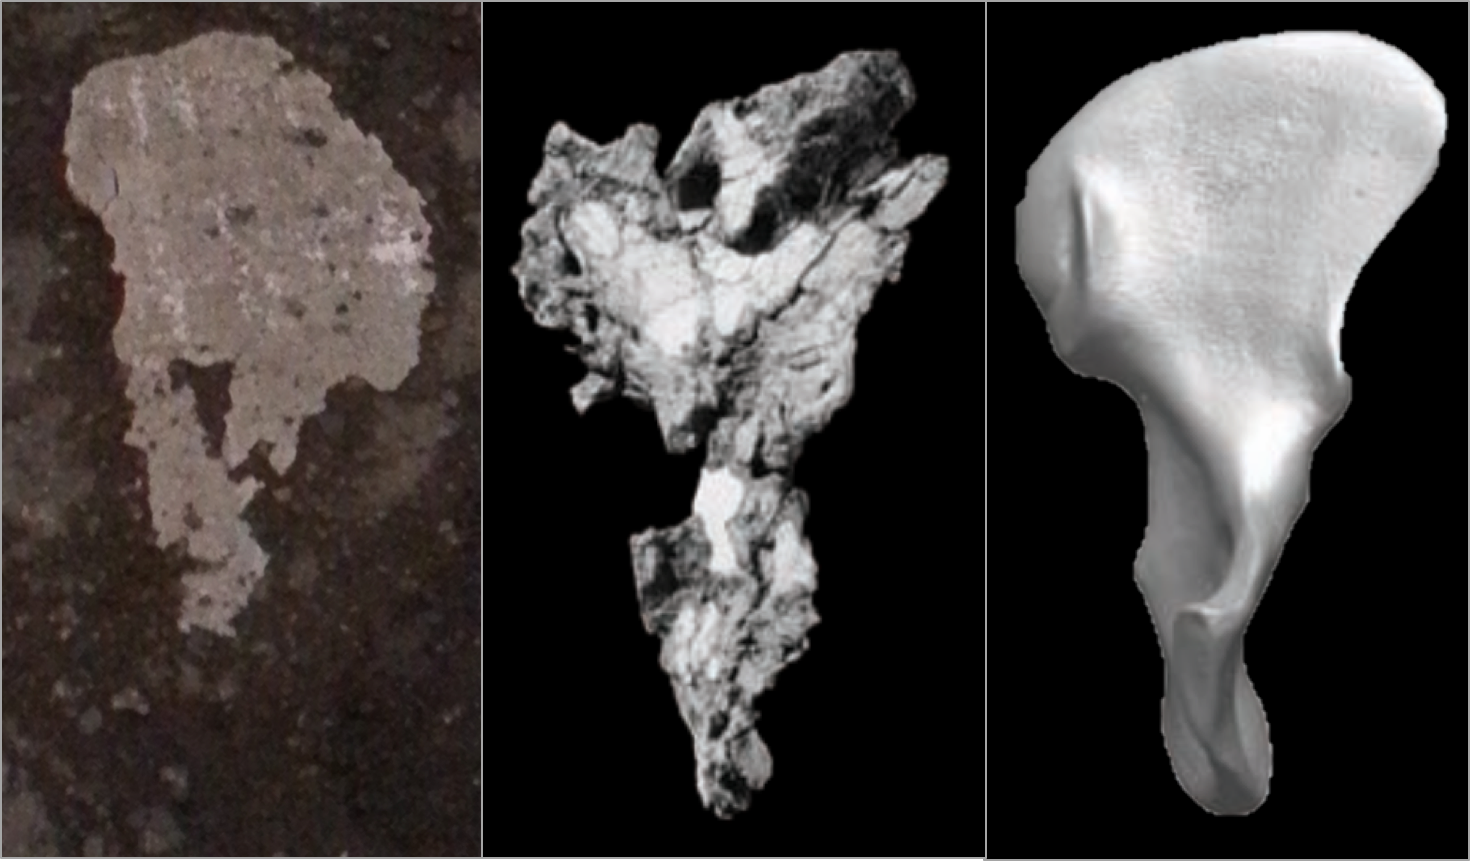
This is a perennial problem for paleoanthropology. Our knowledge of the human past hinges on a few thousands of individuals whose bones and teeth managed to survive and be discovered after several thousands or millions of years. Most of these precious remains are fragmentary and cannot speak for themselves. So, researchers must rely on their own anatomical expertise and a bit of artistic license to reconstruct what many key fossils would have looked like in their original condition.

Over thirty years ago Christophe Zollikofer and colleagues (1995: 283) reported that, “Fossil specimens can be restored, measured and replicated without physical contact using … computer assisted reconstruction.” The development of these “virtual anthropology” methods has made fossil reconstruction much more accessible. Most importantly, virtual methods allow researchers to generate multiple, reasonably realistic reconstructions of the same fossil. As Philipp Gunz and colleagues (2009: 61) noted, “While there typically will be shape differences among equally plausible reconstructions, these different estimates might still support a single conclusion. But they need not do so, and all assumptions must be strenuously challenged if one or more reconstructions, or a statistical analysis based on them, are to be treated as arguments for a scientific claim.”

As these paleo pioneers have also acknowledged, making data publicly available will also help assess the extent to which specific reconstructions might affect subsequent interpretations. Both of these research groups have published 3D landmark datasets with some overlapping specimens, allowing us to address this central question. Simon Neubauer and colleagues (2018) published the landmark data used in their reconstruction and analysis of a juvenile Homo erectus cranium (here). A team led by Marcia Ponce de León (2021) and Christophe Zollikofer (2022) have posted comparable data from their endocast reconstructions of Homo erectus from Dmanisi, Georgia (here) and early Homo sapiens from Herto, Ethiopia (here). These great datasets bear on the evolution of brain size and shape—let’s dig in.

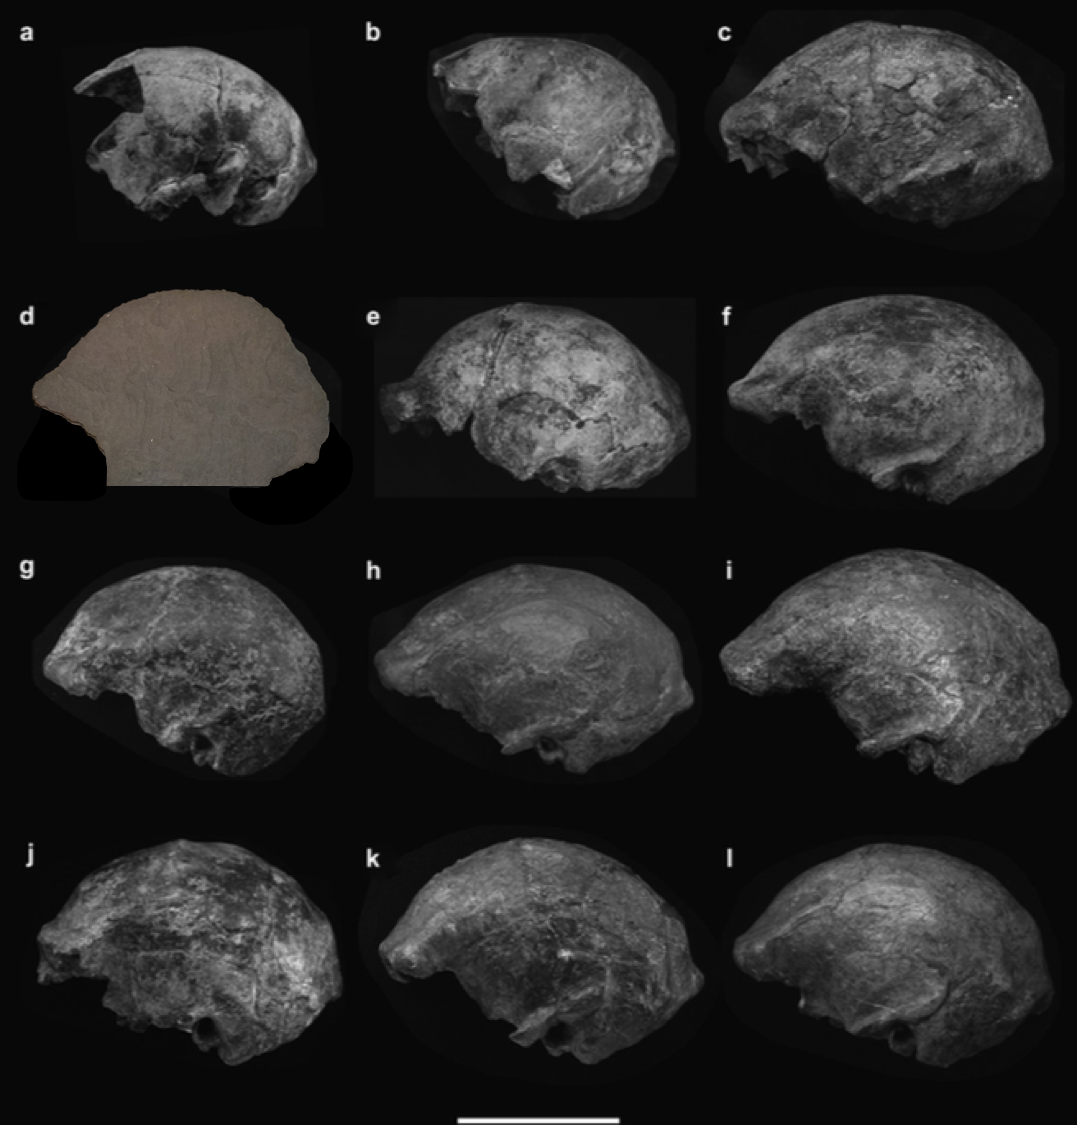
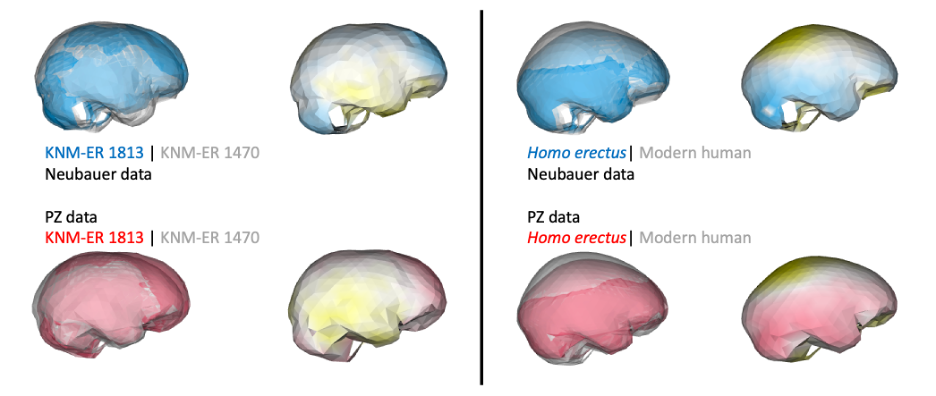
Both groups—Neubauer et al. and Ponce de León et al. + Zollikofer et al. (hereafter “PZ”)—include recent modern humans from different skeletal collections and the same nine fossil Homo specimens: KNM-ER 1813 (H. habilis), KNM-ER 1470 (H. rudolfensis), and seven other fossils from Kenya and Indonesia typically attributed to Homo erectus. Most of the fossils required varying extents of reconstruction, from the alignment of separate cranial fragments to the mathematical estimation of endocranial surfaces that aren’t preserved. The two teams measured endocast shape using comparable but slightly different sets of 3D landmark coordinates, so we can’t combine the datasets but we can run the same set of analyses on each sample separately and then compare the results.

Overall size and shape variation in the two datasets. Left: Centroid size of each specimen with the dashed line indicating parity between samples. Center and right: endocast shape variability within the Neubauer (center) and PZ (right) samples; color-coded 3D models beneath each graphs show how endocast shape varies along PC1.

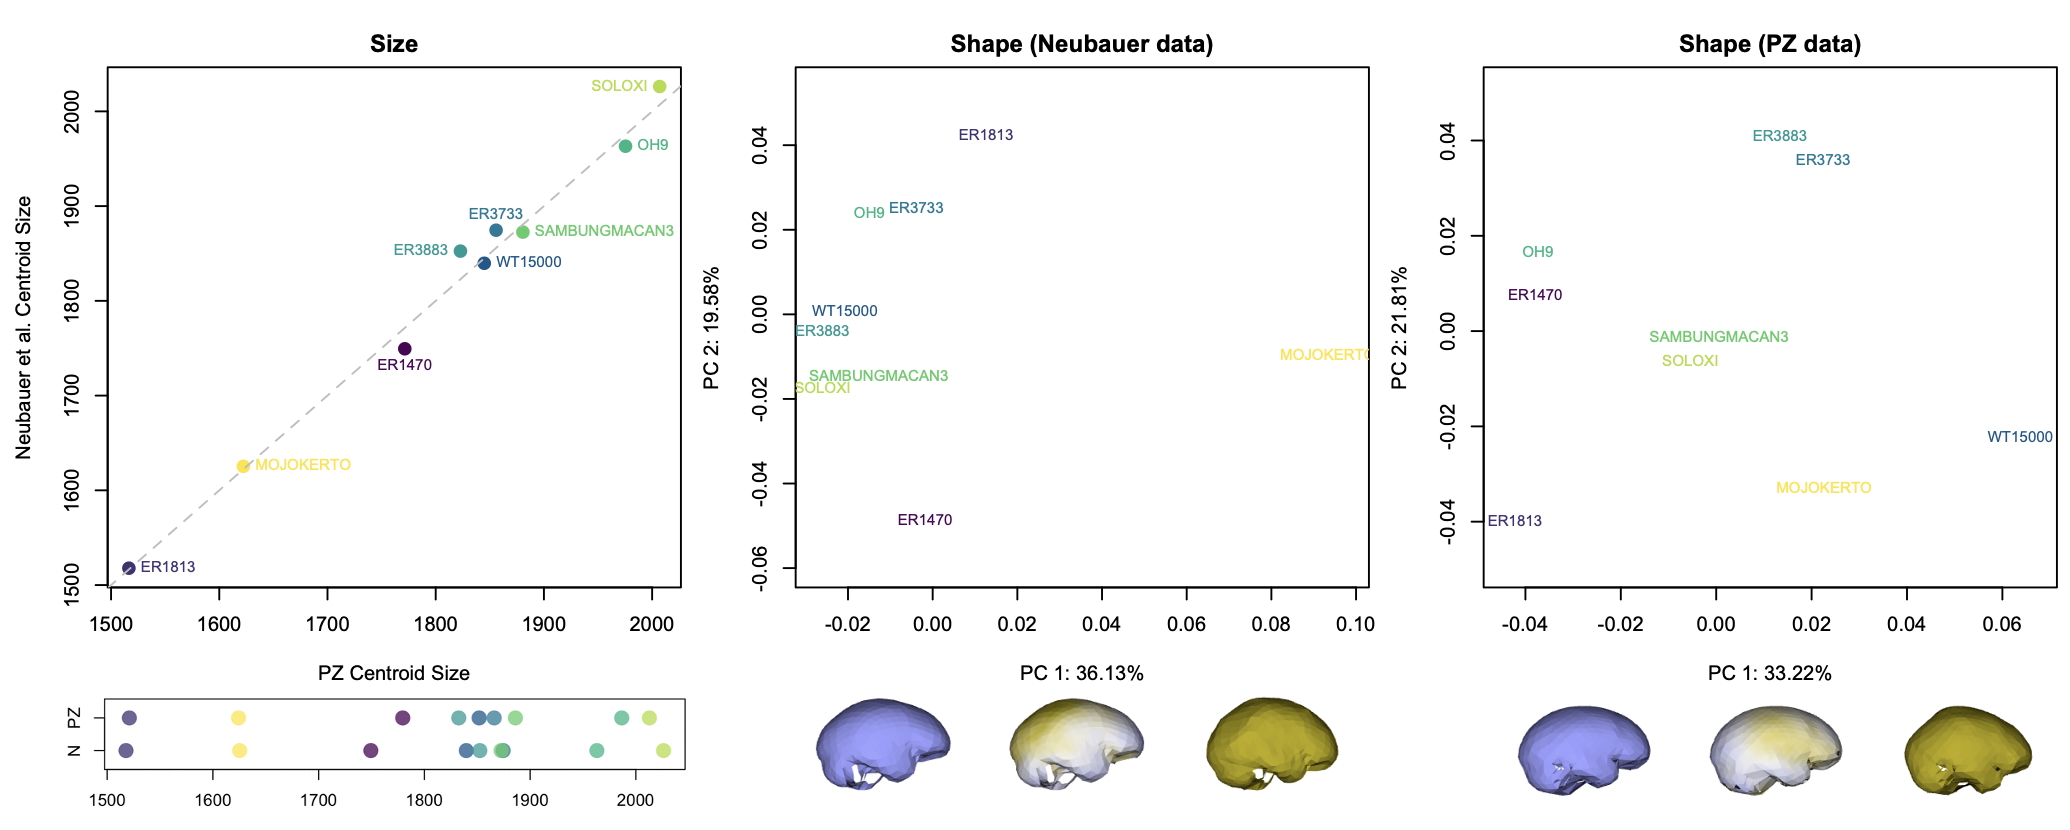
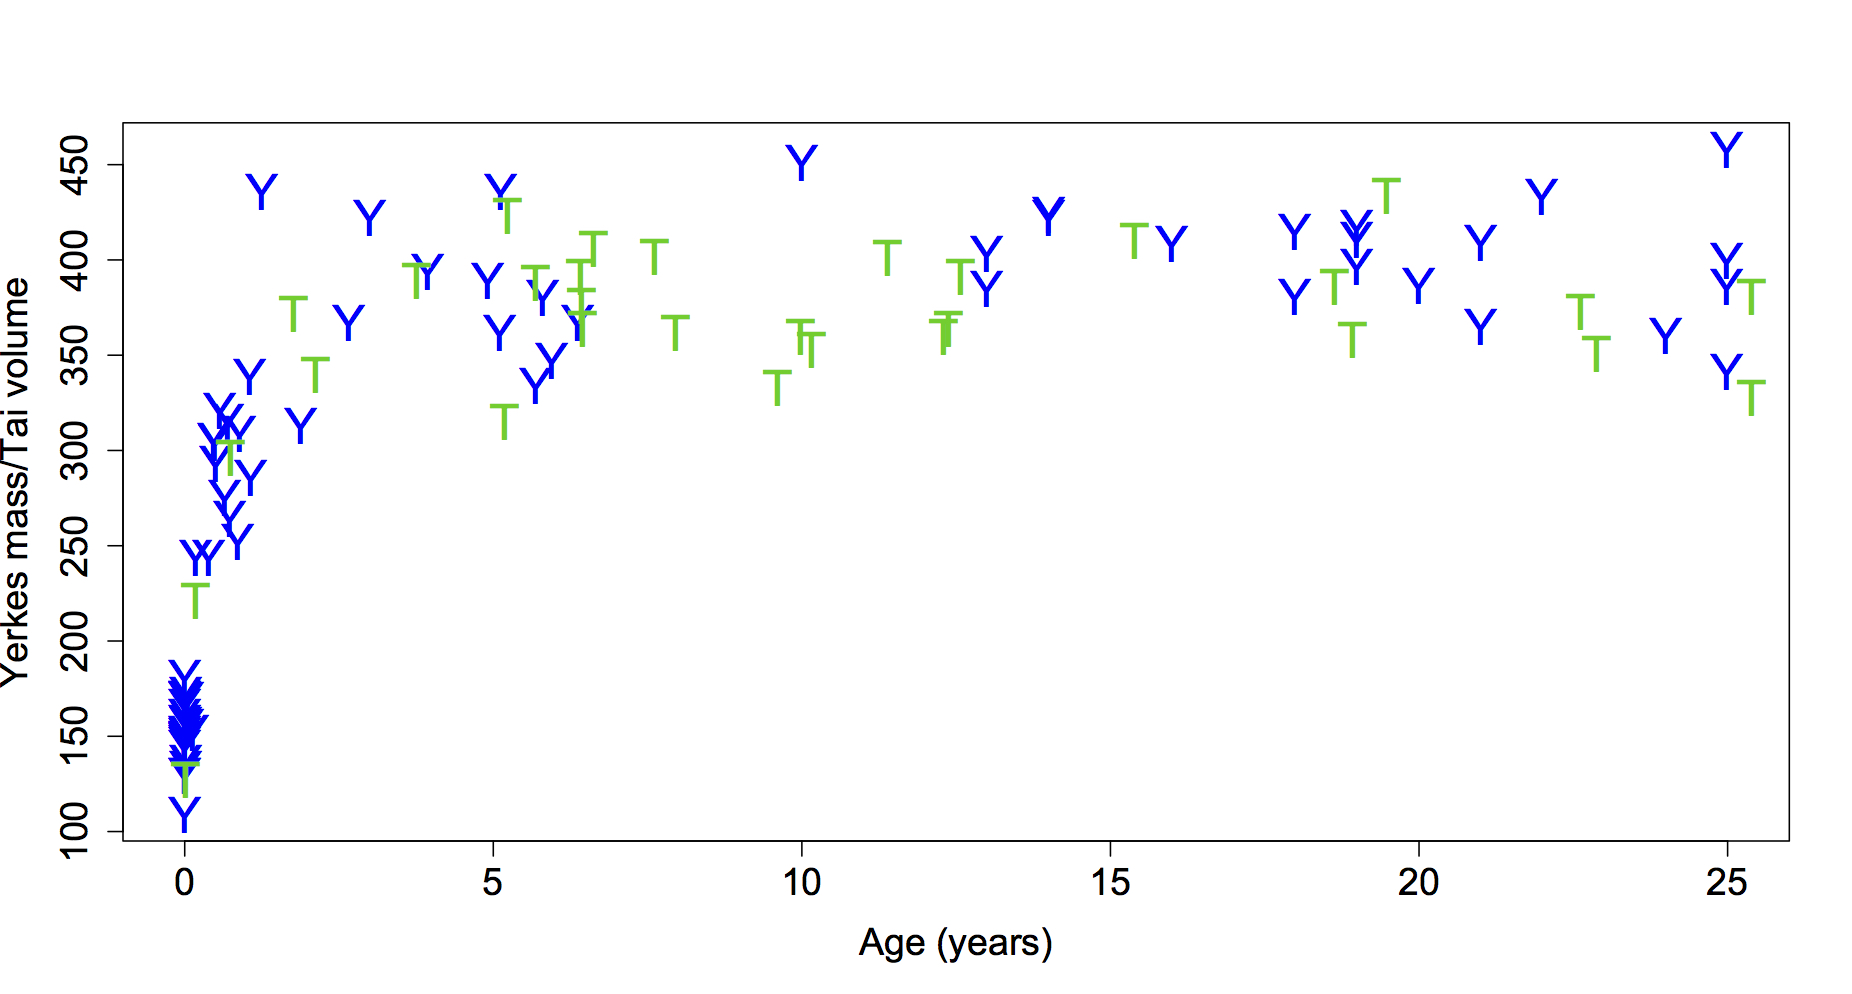
The graphs above show how the nine fossils vary within and between datasets. The 3D landmarks used to measure endocast size and shape return similar overall sizes for each specimen (left graphs). There are differences in the relative positions of a few specimens (ER 3883 vs. WT 15000 and ER 3733 vs. Sambungmacan 3), but these discrepancies are small probably mostly within the range of uncertainty for individual fossil reconstructions.

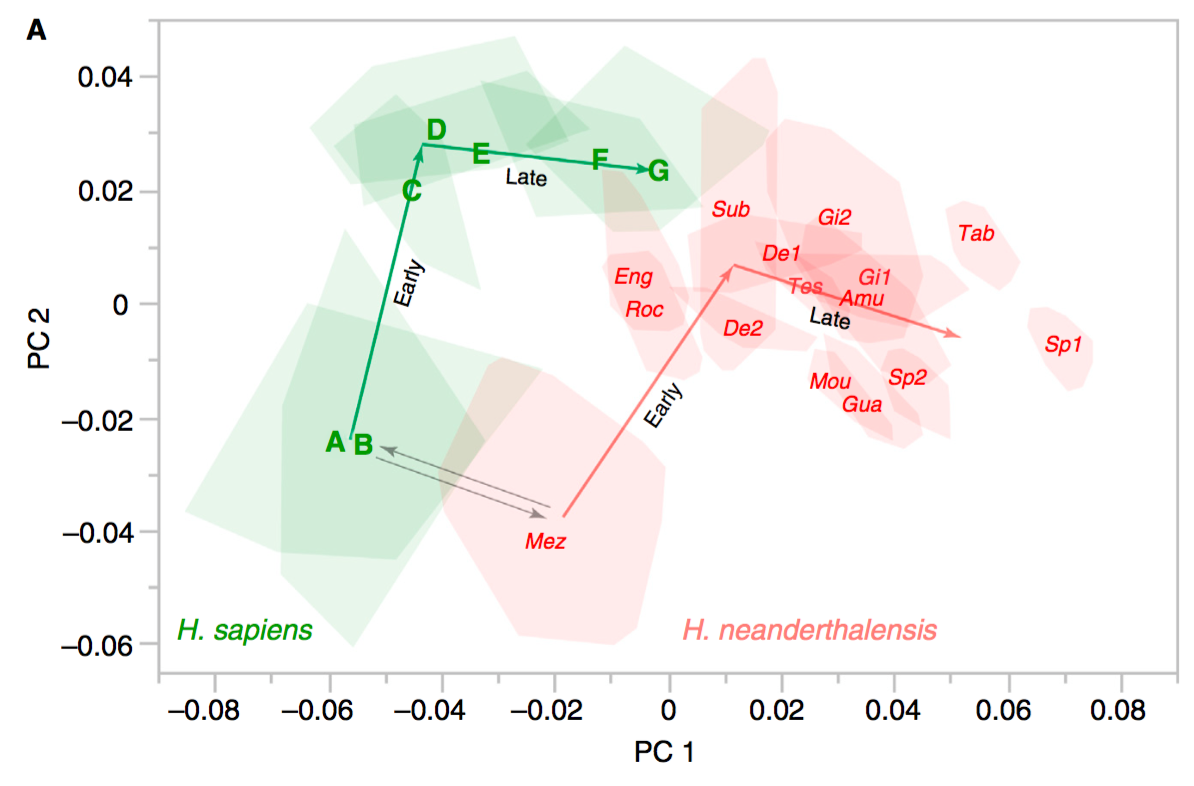
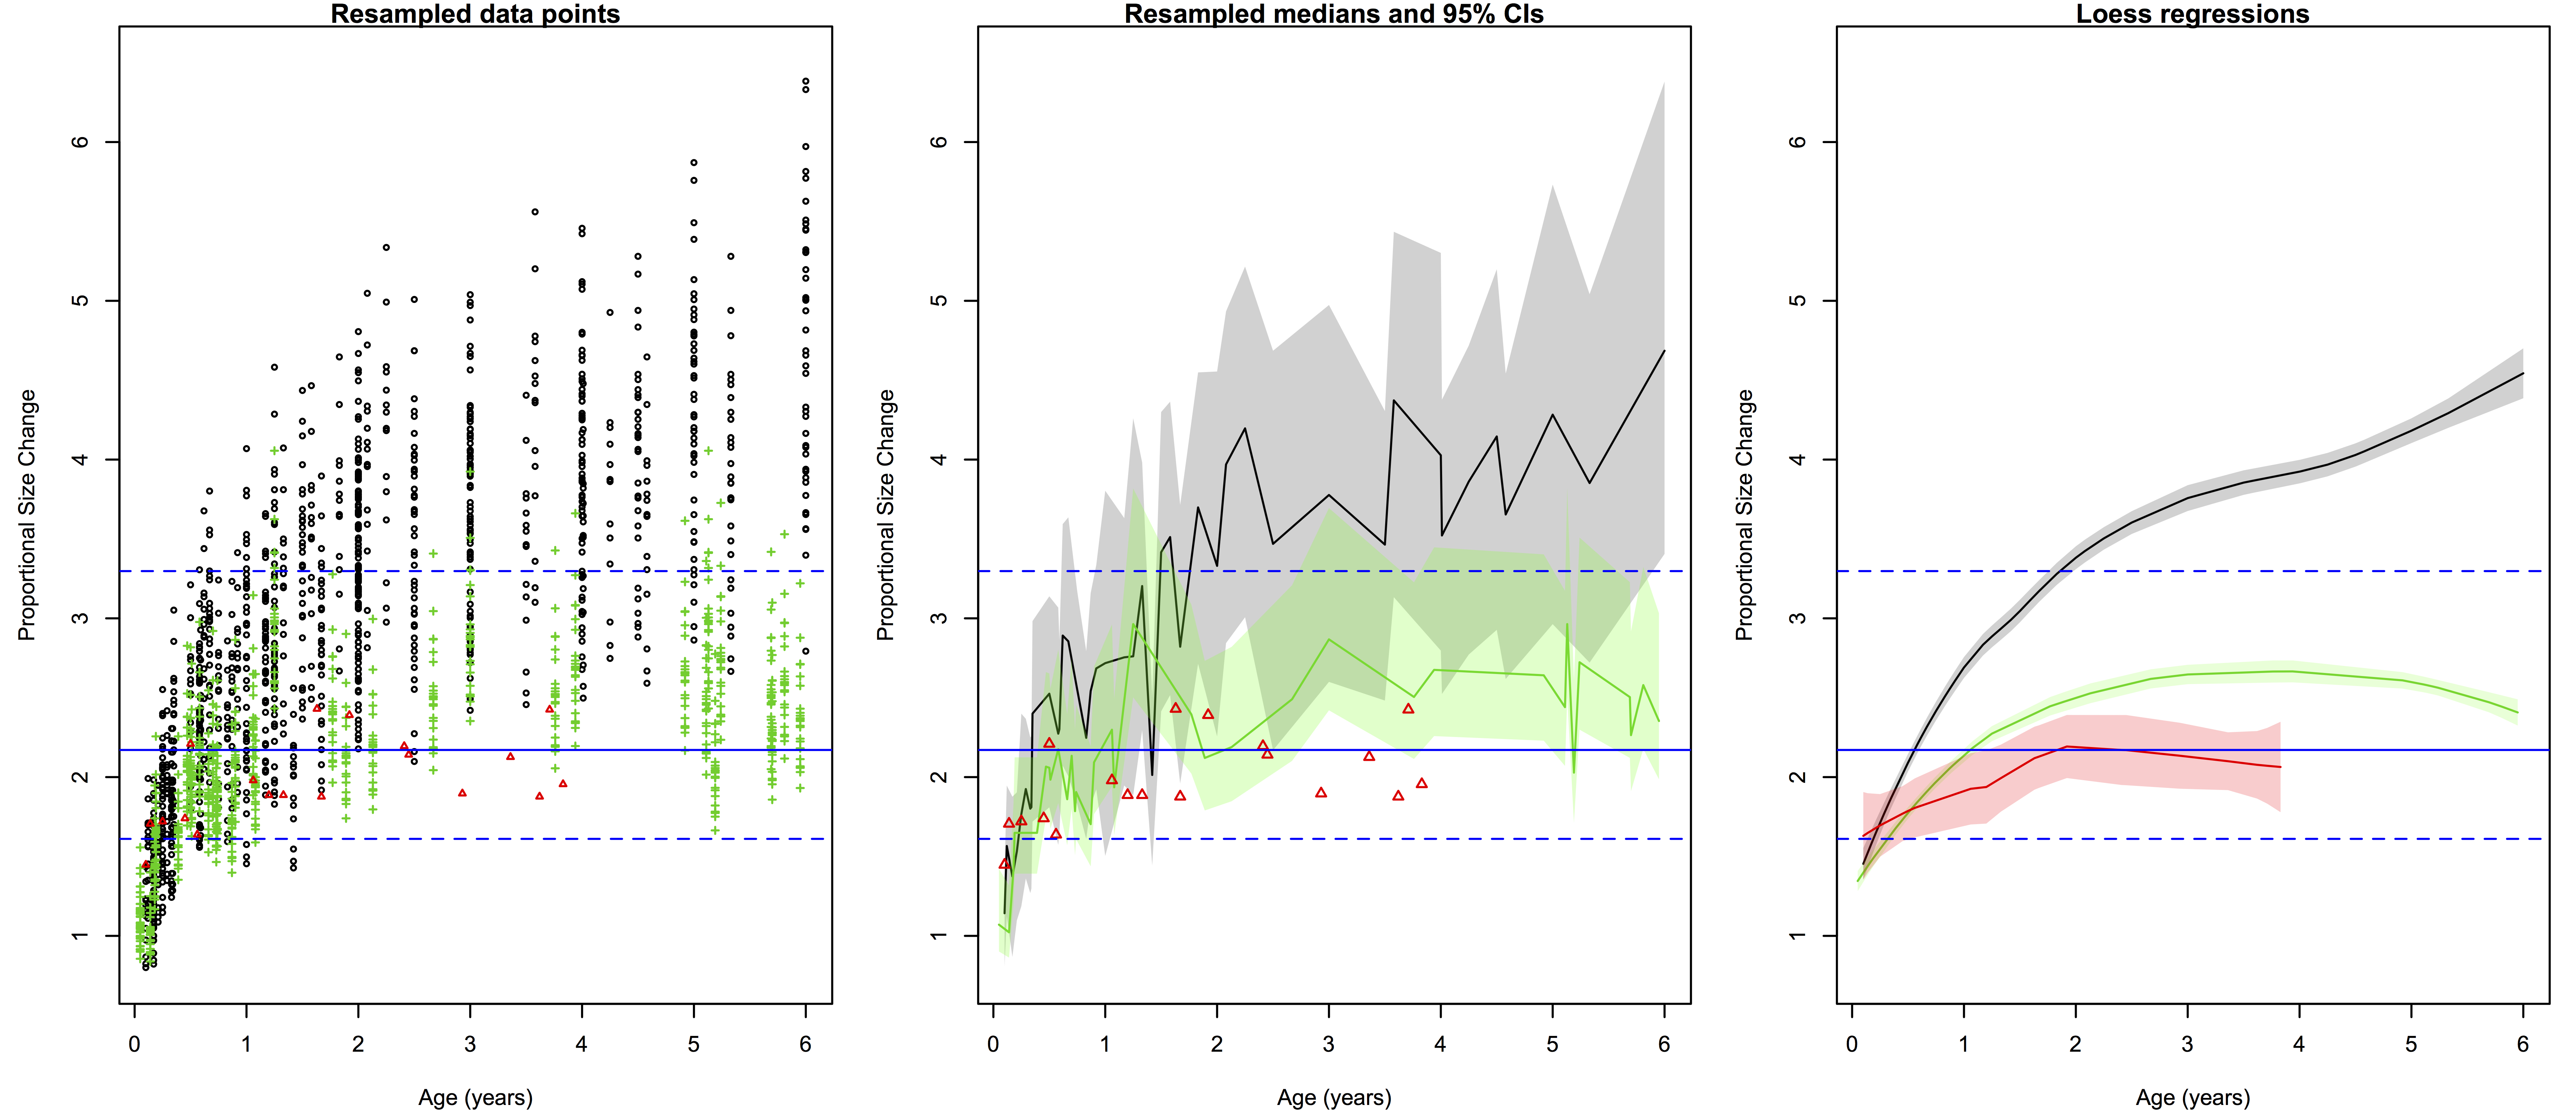
The effects of different reconstructions on endocranial shape, on the other hand, are a bit more profound. In each dataset, the main dimension of variation (PC1, the horizontal axis in the center and right graphs) captures similar patterns of shape variability. In both samples, fossils with a longer and lower endocast fall on the left side of the graph, while rounder endocasts fall on the right side of the graph. But where individual specimens plot in the graphs (i.e., their overall endocast shape) differs notably between datasets. For example, the “Mojokerto” infant Homo erectus has the roundest shape while WT 15000 has one of the ‘flatter’ shapes in the Neubauer sample, whereas WT 15000 is the ‘roundest’ in the PZ sample.

So, different decisions in the reconstruction process can lead to different overall patterns of shape variation within a sample. This can have important impacts on subsequent analyses. For instance, we often want to assess how similar or different fossil specimens are to one another, looking for clusters of similar shapes that might tell us something meaningful about the biology we’re hoping to capture. The two datasets, however, produce slightly different clusters:

Cluster dendrograms based on shape variation within the two endocast datasets. Fossil specimens are color-coded to highlight difference between the two trees.

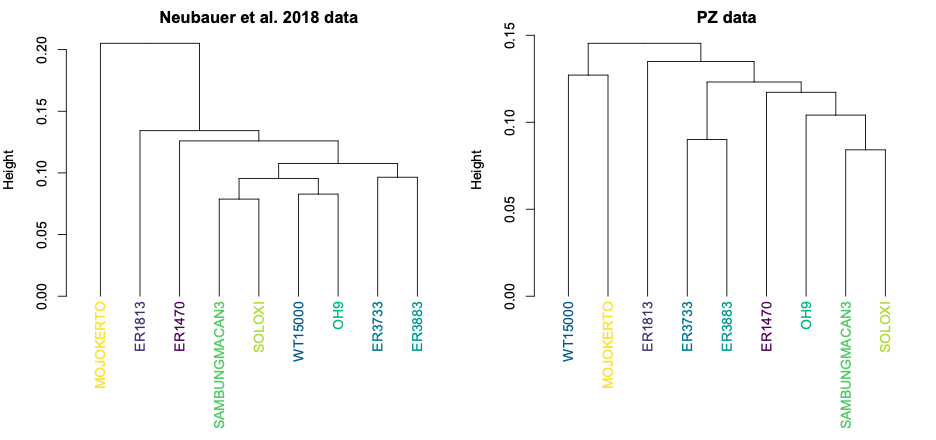
Both datasets produce clusters with early H. erectus specimens ER 3733 and ER 3883, and later Indonesian H. erectus fossils Sambungmacan 3 and Solo XI. But the similarities among other fossils differ between the two samples, in ways that could lead to different biological interpretations. One might interpret the Neubauer clustering to mean that the Mojokerto infant differs from the rest since it hadn’t completed brain growth, while the other clusters could potentially reflect evolutionary changes both from early Homo (ER 1813 and 1470) to H. erectus and over time within H. erectus. In contrast, the PZ tree could be interpreted to mean that the adolescent WT 15000 had an ‘underdeveloped’ brain like Mojokerto, while the different clusters of ER 1813 and ER 1470 could reflect a more convoluted pattern of brain evolution from early Homo to H. erectus.

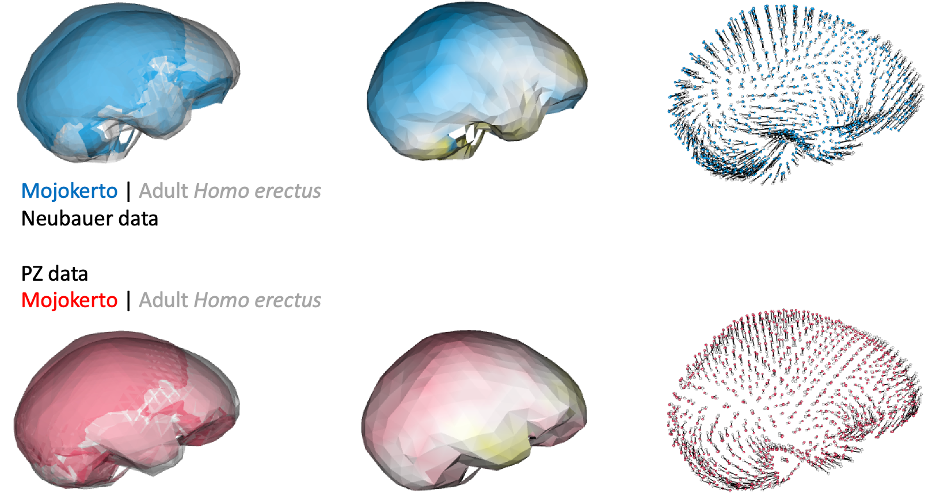
Of course, principal components and cluster analyses are statistical approaches for exploring variation within a sample, and they don’t necessarily map onto meaningful phenomena. Biological patterns could ‘override’ variation due to differences in reconstruction. For instance, endocast shape variation due to growth and development could produce marked, characteristic differences between infants and adults. Indeed, if we compare endocast shape of the infant Mojokerto to the average adult H. erectus, both datasets yield fairly similar results:

Endocast shape differences between the Mojokerto infant and adult H. erectus. In both rows, the left side shows Mojokerto (blue/red) aligned to the adult (gray); note that they are scaled to the same size. The center shows where Mojokerto (blue/red) or the adult (yellow) projects more than the other. On the right, lines between points show how corresponding landmarks differ between Mojokerto and the average adult in each sample.

In addition, if groups/species have distinct endocast shapes, such differences could still be captured by studies using different fossil reconstructions. For instance, both studies produce similar results when comparing early Homo specimens ER 1813 and ER 1470, and comparing adult H. erectus and modern humans:

So, getting back to our original question: do different virtual reconstructions produce different results? Yes and no. Yes, there will be observable differences between studies, and these could be subtle (e.g., brain sizes estimates) or more severe (e.g., clustering patterns within a fossil sample). But as Melvin Moss reminded us, we must keep in mind the underlying biological questions when interpreting statistical patterns. Ultimately, fossil preservation is probably the greatest source of variability between different studies. Many researchers will bring similar levels of expertise and similar analytical toolkits to study fossils, but more fragmentary specimens will have greater uncertainty in how to to reconstruct them. In contrast to the different growth patterns identified in the Neandertal studies mentioned at the beginning of this post, the consistent ‘growth’ signal in H. erectus fossils may be due to the fact that the Mojokerto infant is better preserved and required less reconstruction than Neandertal neonates.

As Gunz and colleagues (2009) stressed when they laid out “principles for the virtual reconstruction of hominin crania,” these powerful virtual methods can never produce “the” single correct reconstruction of a fossil. Rather, researchers must acknowledge and remain cognizant of all the decisions and assumptions that go into their reconstructions, and attempt to produce multiple reconstructions reflecting these varied uncertainties. Making data openly available further allows other researchers to assess how conclusions were reached, and to add new fossils to existing datasets.

REFERENCES

Baab, K. L. (2025). A fresh look at an iconic human fossil: Virtual reconstruction of the KNM-WT 15000 cranium. Journal of Human Evolution, 202, 103664. https://doi.org/10.1016/j.jhevol.2025.103664

Gunz, P., Mitteroecker, P., Neubauer, S., Weber, G. W., & Bookstein, F. L. (2009). Principles for the virtual reconstruction of hominin crania. Journal of Human Evolution, 57(1), 48–62. https://doi.org/10.1016/j.jhevol.2009.04.004

Neubauer, S., Gunz, P., Leakey, L., Leakey, M., Hublin, J.-J., & Spoor, F. (2018). Reconstruction, endocranial form and taxonomic affinity of the early Homo calvaria KNM-ER 42700. Journal of Human Evolution, 121, 25–39. https://doi.org/10.1016/j.jhevol.2018.04.005

Ponce De León, M. S., Bienvenu, T., Marom, A., Engel, S., Tafforeau, P., Alatorre Warren, J. L., Lordkipanidze, D., Kurniawan, I., Murti, D. B., Suriyanto, R. A., Koesbardiati, T., & Zollikofer, C. P. E. (2021). The primitive brain of early Homo. Science, 372(6538), 165–171. https://doi.org/10.1126/science.aaz0032

Zollikofer, C. P. E., Bienvenu, T., Beyene, Y., Suwa, G., Asfaw, B., White, T. D., & Ponce De León, M. S. (2022). Endocranial ontogeny and evolution in early Homo sapiens: The evidence from Herto, Ethiopia. Proceedings of the National Academy of Sciences, 119(32), e2123553119. https://doi.org/10.1073/pnas.2123553119

Zollikofer, C. P. E., Ponce de León, M. S., Martin, R. D., & Stucki, P. (1995). Neanderthal computer skulls. Nature, 375(6529), 283–285. https://doi.org/10.1038/375283b0

New course: “Is the Human Brain Special?”

For the first time in many years, I’m offering a new advanced undergrad seminar here at Vassar. When I arrived here 8 years ago, I was mainly thinking about Homo naledi and ontogeny, so those were the foci of my seminars. But my research has begun looking more at brain evolution and especially the evidence from fossil endocasts, and there is a lot of literature I need to catch up on.

So I’ve invited students along for this brainstorm, using the question “Is the human brain special?” as a starting point to learn about how the beautifully congealed soup sloshing around inside our skull makes us such quirky animals. In the first half of the semester we’ll read up on brain anatomy and structure, and students will use some of the fossil endocast data I’ve accrued over the years to learn more about a given brain region and extinct hominin. In the second half of the semester we’ll read about the brains, behavior, and endocast fossils of very distant relatives — invertebrates, birds, whales, and dogs — that have been celebrated for their own ‘advanced intelligence.’ We’ll also read about how the evolution of our brains may have predisposed us to certain conditions like addiction and Alzheimer’s, and how brain science has been exploited toward racist and sexist ends (increasingly relevant in America today, sadly).

It will be a lot of work (I’m a very slow, distractible reader) but I’m excited to delve into this literature and see what insights our super sharp students here at Vassar come up with in discussions and projects. The course syllabus (ANTH 323) is available on my Teaching page — I’d be keen to hear suggestions for readings and assignments from folks who know more about brains than I do!

Worst year in review

As we’re wrapping up what may be the worst year in recent global memory, especially geopolitically, let’s take a moment to review some more positive things that came up at Lawnchair in 2016.

Headed home

IMG_20160801_143520

Alternate subtitle: Go West
This was a quiet year on the blog, with only 18 posts compared with the roughly thirty per year in 2014-2015. The major reason for the silence was that I moved from Kazakhstan back to the US to join the Anthropology Department at Vassar College in New York. With all the movement there was  less time to blog. Much of the second half of 2016 was spent setting up the Biological Anthropology Lab at Vassar, which will focus on “virtual” anthropology, including 3D surface scanning…

20161111_141908.jpg

Cast of early Homo cranium KNM-ER 1470 and 3D surface scan made in the lab using an Artec Spider.

… and 3D printing.

20161107_135616

gibbon endocast, created from a CT scan using Avizo software and printed on a Zortrax M200.

This first semester stateside I reworked my ‘Intro to Bio Anthro’ and ‘Race’ courses, which I think went pretty well being presented to an American audience for the first time. The latter class examines human biological variation, situating empirical observations in modern and historical social contexts. This is an especially important class today as 2016 saw a rise in nationalist and racist movements across the globe. Just yesterday Sarah Zhang published an essay in The Atlantic titled, “Will the Alt-right peddle a new kind of racist genetics?” It’s a great read, and I’m pleased to say that in the Race class this semester, we addressed all of the various social and scientific issues that came up in that piece. Admittedly though, I’m dismayed that this scary question has to be raised at this point in time, but it’s important for scholars to address and publicize given our society’s tragically short and selective memory.

So the first semester went well, and next semester I’ll be teaching a seminar focused on Homo naledi and a mid-level course on the prehistory of Central Asia. The Homo naledi class will be lots of fun, as we’ll used 3D printouts of H. naledi and other hominin species to address questions in human evolution. The Central Asia class will be good prep for when I return to Kazakhstan next summer to continue the hunt for human fossils in the country.

Osteology is still everywhere

A recurring segment over the years has been “Osteology Everywhere,” in which I recount how something I’ve seen out and about reminds me of a certain bone or fossil. Five of the blog 18 posts this year were OAs, and four of these were fossiliferous: I saw …

2016-02-09 16.26.31

Anatomy terminology hidden in 3D block letters,

Picture1

Hominin canines in Kazakhstani baursaki cakes,

Picture1

The Ardipithecus ramidus ilium in Almaty,

screen-shot-2016-11-26-at-5-36-05-pm

Homo naledi juvenile femur head in nutmeg,

bangkok-erectus

And a Homo erectus cranium on a Bangkok sidewalk. As I’m teaching a fossil-focused seminar next semester, OA will probably become increasingly about fossils, and I’ll probably get my students involved in the fun as well.

New discoveries and enduring questions

The most-read post on the blog this year was about the recovery of the oldest human Nuclear DNA, from the 450,000 year old Sima de los Huesos fossils. My 2013 prediction that nuclear DNA would conflict with mtDNA by showing these hominins to be closer to Neandertals than Denisovans was shown to be correct.

giphy

These results are significant in part because they demonstrate one way that new insights can be gained from fossils that have been known for years. But more intriguingly, the ability of researchers to extract DNA from exceedingly old fossils suggests that this is only the tip of the iceberg.

The other major discoveries I covered this year were the capuchin monkeys who made stone tools and the possibility that living humans and extinct Neandertals share a common pattern of brain development.

Pride & Predator

An unrelated image from 2016 that makes me laugh.

The comparison between monkey-made and anthropogenic stone tools drives home the now dated fact that humans aren’t the only rock-modifiers. But the significance for the evolution of human tool use is less clear cut – what are the parallels (if any) in the motivation and modification of rocks between hominins and capuchins, who haven’t shared a common ancestor for tens of millions of years? I’m sure we’ll hear more on that in the coming years.

In the case of whether Neandertal brain development is like that of humans, I pointed out that new study’s results differ from previous research probably because of differences samples and methods. The only way to reconcile this issue is for the two teams of researchers, one based in Zurich and the other in Leipzig, to come together or for a third party to try their hand at the analysis. Maybe we’ll see this in 2017, maybe not.

There were other cool things in 2016 that I just didn’t get around to writing about, such as the publication of new Laetoli footprints with accompanying free 3D scans, new papers on Homo naledi that are in press in the Journal of Human Evolution, and new analysis of old Lucy (Australopithecus afarensis) fossils suggesting that she spent a lifetime climbing trees but may have sucked at it. But here’s hoping that 2017 tops 2016, on the blog, in the fossil record, and basically on Earth in general.

Did Neandertal brains grow like humans’ or not?

According to Marcia Ponce de Leon and colleagues, “Brain development is similar in Neandertals and modern humans.” They reached this conclusion after comparing how the shape of the brain case changes across the growth period of humans and Neandertals. This finding differs from earlier studies of Neandertal brain shape growth (Gunz et al. 2010, 2012).

Although Neandertals had similar adult brain sizes as humans do today, the brains are nevertheless slightly different in shape:

Screen Shot 2016-07-26 at 4.31.52 PM

Endocranial surfaces of a human (left, blue) and Neandertal (right, red), from Gunz et al. (2012). These surfaces reflect the size and shape of the brain, blood vessels, cerebrospinal fluid, and meninges.

Gunz et al. (2010, 2012) previously showed that endocranial development in humans, but not in Neandertals or chimpanzees, has a “globularization phase” shortly after birth: the endocranial surface becomes overall rounder, largely as a result of the expansion of the cerebellum:

Screen Shot 2016-07-26 at 4.38.39 PM

Endocranial (e.g., brain) shape change in humans (blue), Neandertals (red) and chimpanzees (green), Fig. 7 from Gunz et al. (2012). Age groups are indicated by numbers. The human “globularization phase” is represented by the great difference in the y-axis values of groups 1-2 (infants). The Neandertals match the chimpanzee pattern of shape change; Neandertal neonates (LeM2 and M) do not plot as predicted by a human pattern of growth.

Ponce de Leon and colleagues now challenge this result with their own similar analysis, suggesting similar patterns of shape change with Neandertals experiencing this globularization phase as well (note that endocranial shapes are always different, nevertheless):

Screen Shot 2016-07-26 at 4.47.13 PM

Endocranial shape change in humans (green) and Neandertals (red), from Ponce de Leon et al. (2016). Note that the human polygons and letters represent age groups, whereas the Neandertal polygons and labels are reconstructions of individual specimens.

The biggest reason for the difference between studies is in the fossil sample. Ponce de Leon et al. have a larger fossil sample, with more non-adults including Dederiyeh 1-2, young infants in the age group where human brains become more globular.

Screen Shot 2016-07-26 at 5.01.17 PM

Comparison of fossil samples between the two studies.

But I don’t think this alone accounts for the different findings of the two studies. Overall shape development is depicted in PC 1: in general, older individuals have higher PC1 scores. The globularization detected by Gunz et al. (2010; 2012) is manifest in PC2; the youngest groups overlap entirely on PC1. The biggest difference I see between these studies is where Mezmaiskaya, a neonate, falls on PC2. In the top plot (Gunz et al., 2012), both Mezmaiskaya and the Le Moustier 2 newborn have similar PC2 values as older Neandertals. In the bottom plot (Ponce de Leon et al., 2012), the Mezmaiskaya neonate has lower PC2 scores than the other Neandertals. Note also the great variability in Mezmaiskaya reconstructions of Ponce de Leon et al. compared with Gunz et al.; some of the reconstructions have high PC2 values which would greatly diminish the similarity between samples. It’s also a bit curious that Engis and Roc de Marsal appear “younger” (i.e., lower PC1 score) than the Dederiyeh infants that are actually a little bit older.

Ponce de Leon et al. acknowledge the probable influence of fossil reconstruction methods, and consider other reasons for their novel findings, in the supplementary material. Nevertheless, a great follow-up to this, to settle the issue of Neandertal brain development once and for all, would be for these two research teams to join forces, combining their samples and comparing their reconstructions.

REFERENCES

ResearchBlogging.org

Gunz P, Neubauer S, Maureille B, & Hublin JJ (2010). Brain development after birth differs between Neanderthals and modern humans. Current Biology : 20 (21) PMID: 21056830

Gunz P, Neubauer S, Golovanova L, Doronichev V, Maureille B, & Hublin JJ (2012). A uniquely modern human pattern of endocranial development. Insights from a new cranial reconstruction of the Neandertal newborn from Mezmaiskaya. Journal of Human Evolution, 62 (2), 300-13 PMID: 22221766

Ponce de León, M., Bienvenu, T., Akazawa, T., & Zollikofer, C. (2016). Brain development is similar in Neanderthals and modern humans Current Biology, 26 (14) DOI: 10.1016/j.cub.2016.06.022

Brain size growth in wild and captive chimpanzees

Update: research in this post was eventually published in American Journal of Primatology here

I’m back in Astana, overcoming jet lag, after the annual conference of the American Association of Physical Anthropologists, which was held in my home state of Missouri. I’d forgotten how popular ranch dressing and shredded cheese is out there. It was also nice to be surrounded by colleagues interested in evolution, primates, and fossils.

Although I usually present in evolution and fossil-focused sessions, my recent interest in brain growth landed me in a session devoted to Primate Life History this year. The publication of endocranial volumes (ECVs) from wild chimpanzees of known age from Taï Forest (Neubauer et al., 2012) led me to ask whether this cross-sectional sample displays the same pattern of size change as seen in captive chimpanzee brain masses (Herndon et al., 1999). These are unique datasets because precise ages are known for each individual, and this information is generally lacking for most skeletal populations. We therefore have a unique opportunity to estimate patterns and rates of growth, and to compare different populations. Here are the data up to age 25 (the oldest known age of the wild chimps):

fig2 raw data copy

Brain size plotted against age in chimpanzees. Blue Ys are the Yerkes (captive) apes and green Ts are the Taï (wild) chimps. Note that Yerkes data are brain masses while the Taï data are endocranial volumes (ECVs). Mass and volume – as different as apples and oranges, or as oranges and tangerines? Note the relatively high “Y” at 1.25 years, who was omitted from the subsequent analysis.

This is an interesting comparison for a few reasons. First, to the best of my knowledge brain size growth hasn’t been compared between chimp populations (although it has been compared between chimps and bonobos: Durrleman et al., 2012). Second, many studies have found differences in tooth eruption, maturation and skeletal growth and development between wild and captive animals, but again I don’t think this has been examined for brain growth. Finally, and most fundamentally, it’s not clear whether ECV and brain mass follow the same basic pattern of change (brain mass but not ECV is known to decrease at older ages in humans and chimps, but at younger ages…?.

So to first make the datasets comparable, I used published data to examine the relationship between brain mass and ECV in primates, to estimate the likely ECV of the Yerkes brain masses. Two datasets examine adult brain size across different primate species (red and blue in the plot below), and one looks at brain mass and ECV of individuals for a combined sample of gorillas (McFarlin et al., 2013) and seals (Eisert et al., 2013). In short, ECV and brain mass in these datasets give regression slopes not significantly different from 1. One dataset has a negative y-intercept significantly different from 0, meaning that ECV should actually be slightly less than brain mass, but I think this pattern is driven by the really small-brained animals like New World Monkeys).

Untitled

The relationship between endocranial volume and brain mass in primates (and Weddell seals). Solid lines and shaded confidence intervals are given for each regression, and the dashed line represents isometry, or a 1:1 relationship (ECV=brain mass). The rug at the bottom shows the range of the Yerkes masses. Note that the red and black regressions are not significantly different from isometry, while the blue regression is shifted slightly below isometry.

So let’s assume for now that the ECVs of the Yerkes apes are the same as their masses, meaning the two datasets are directly comparable. There are lots of ways to mathematically model growth, and as George Box famously quipped, “All models are wrong, but some are useful.” Here, I wanted to use something that explained the greatest amount of ontogenetic variation in ECV while also levelling off once adult brain size was reached (by 5 years based on visual inspection of the first plot above). This led me to the B-spline. With some tinkering I found that having two knots, one between each 0.1-2.5 and 2.6-5, provided models that fit the data pretty well, and I resampled knot combinations to find the best fit for each dataset. The result:

B-splines describing the relationship between ECV (or brain mass) and age in the TaÏ (green) and Yerkes (blue) data. Although resampling identified different knots for each sample, the regression coefficients are not significantly different.

B-splines describing the relationship between ECV (or brain mass) and age in the TaÏ (green) and Yerkes (blue) data. Note that although the Yerkes line is elevated above the Taï line after 4 years, the confidence intervals (shaded regions) overlap at all ages.

These models fit the data pretty well (r-squared >0.90), and nicely capture the major changes in growth rates. Resampling knot positions reveals best-fit models with different knots for each sample, but otherwise the two models cannot be statistically distinguished from one another: the 95% confidence intervals of both the model coefficients and brain size estimates overlap. So statistical modelling of brain growth in these samples suggests they’re the same, but there are some hints of difference.

Growth rates at each age calculated from the B-spline regressions. Note these are arithmetic velocities and not first derivatives of the growth curves.

Growth rates at each age calculated from the B-spline regressions. Note these are arithmetic velocities and not first derivatives of the growth curves. The dashed horizontal line at 0 indicates the end of brain size growth.

Converting the growth curves to arithmetic velocities we see what accounts for the subtle differences between samples. The velocity plot hints that, in these cross-sectional data, brain size increases rapidly after birth but growth slows down and ends sooner in Taï than among the Yerkes apes. I’m cautious about over-interpreting this difference, since there is great overlap between growth curves, and there is only one Taï newborn compared to about 20 in Yerkes: even just a few more newborns from Taï might reveal greater similarity with Yerkes.

So there you have it, it looks like the wild Taï and captive Yerkes chimps follow basically the same pattern of brain growth, despite living in different environments. Whereas the generally greater stressors in the wild often lead to different patterns of skeletal and dental development in wild vs. captive settings, brain growth appears pretty robust to these environmental differences. That brain growth should be canalized is not too surprising, given the importance of having a well-developed brain for survival and reproduction. But it’s cool to see this theoretical expectation borne out with empirical observations.

#AAPA2015

Tomorrow I’m heading to St. Louis, MO for the annual meeting of the American Association of Physical Anthropologists. I’ll be giving a talk on Saturday presenting results of a comparison of brain size growth between captive and wild chimpanzees. Some recent work has highlighted differences between captive and wild animals in terms of bodily growth and maturation, but so far as I know brain development has not been part of this. Here’s a teaser plot, showing how the captive (blue) and wild (green) datasets deviate from a piecewise linear regression of brain size against age (for the combined wild+captive sample):

Rplot copyThe dashed black line is zero, or no deviation from the model. This plot shows that each dataset deviates little from the model at younger ages (when the brain is growing rapidly), but at older ages the captive animals have larger brains, and the wild animals have smaller brains, than predicted by the model. What’s the meaning of this? Find out Saturday afternoon at 3 pm…

2015 AAPA conference: More brain growth

The American Association of Physical Anthropologists is holding its annual meeting next year in St. Louis, in my home state of Missouri (I’m from Kansas City, which is by far the best city in the state, if not the entirety of the Midwest). I’ll be giving a talk comparing brain size growth in captive and wild chimpanzees, on Saturday 28 March in the Primate Life History session. Here’s a sneak peak:

Velocity curve for brain size from birth to 5 years in wild (green) and caprive (blue) chimpanzees. For the captive models, the dashed line is fit to the raw brain masses, and the solid line is fit to the estimated endocranial volumes.

Velocity curves for brain size growth from birth to 5 years in wild (green) and captive (blue) chimpanzees. The wild data are endocranial volumes, but the captive specimens are represented by brain masses. So the captive data are modeled for both the original masses (dashed) and estimated volumes (solid). Wild data are from Neubauer et al. 2011, captive data from Herndon et al., 1999.

Abstract: This study compares postnatal brain size change in two important chimpanzee samples: brain masses of captive apes at the Yerkes National Primate Research Center, and endocranial volumes (ECVs) of wild-collected individuals from the Taï Forest. Importantly, age at death is known for every individual, so these cross-sectional samples allow inferences of patterns and rates of brain growth in these populations. Previous studies have revealed differences in growth and health between wild and captive animals, but such habitat effects have yet to be investigated for brain growth. It has also been hypothesized that brain mass and endocranial volume follow different growth curves. To address these issues, I compare the Yerkes brain mass data (n=70) with the Taï ECVs (n=30), modeling both size and velocity change over time with polynomial regression. Yerkes masses overlap with Taï volumes at all ages, though values for the former tend to be slightly elevated over the latter. Velocity curves indicate that growth decelerates more rapidly for mass than ECV. Both velocity curves come to encompass zero between three and four years of age, with Yerkes mass slightly preceding Taï ECV. Thus, Yerkes brain masses and Taï ECVs show a very similar pattern of size change, but there are minor differences indicating at least a small effect of differences in habitat, unit of measurement, or a combination of both. The overall similarity between datasets, however, points to the canalization of brain growth in Pan troglodytes.

A picture is worth a thousand datapoints in #rstats

I’m finally about to push my study of brain growth in H. erectus out of the gate, and one of the finishing touches was to make pretty pretty pictures. Recall from the last post on the subject that I was resampling pairs of individual brain sizes to compute how much proportional brain size change (PSC) occurred from birth a given age in humans and chimpanzees (and now gorillas). This resulted in lots of data points, which can be a bit difficult to read and interpret when plotted. Ah, cross-sectional data. “HOW?!” I asked, “HOW CAN I MAKE THIS MORE DIGESTIBLE?” Having nice and clean plots is useful regardless of what you study, so here I’ll outline some solutions to this problem. (If you want to figure this out for yourself, here are the raw resampled data. Save it as a .csv file and load it into R)

All

Ratios of proportional size change from birth to a later age. Black/gray=humans, green=chimpanzees, red=gorillas. Left are all 2000 resampled ratios, center shows the medians (solid lines) and 95% quantiles of the ratios for each species at a given age (the small gorilla sample is still data points), and right are the loess regression lines and (shaded) 95% confidence intervals. Blue lines across all three plots are the H. erectus median (solid) and 95% quantiles (dashed).

The left-most plot above shows the raw resampled ratios: you can see a lot of overlap between humans (black), chimpanzees (green) and gorillas (red). But all those points are a bit confusing: just how extensive is the overlap? What is the central tendency of each species?

The second plot shows a less noisy way of displaying the results. We can highlight the central tendencies by plotting PSC medians for each age (I used medians and not means since the data are not normally distributed), and rather than showing the full range of variation in PSC at each age, we can simply highlight the majority (95%) of the values.

To make such a plot in R, for each species you need four pieces of information, in vector form: 1) the unique (non-repeated) ages sorted from smallest to largest, and the 2) median, 3) upper 97.5% quantile, and 4) lower 0.025% quantile for each unique age. You can quickly and easily create these vectors using R‘s built-in commands:

R codes to create the vectors of points to be plotted in the second graph. Note that vectors are not created for gorillas because the sample size is too small, or for H. erectus because the distribution is basically the same across all ages.

R codes to create the vectors of points to be plotted in the second graph. Note that vectors are not created for gorillas because the sample size is too small, or for H. erectus because the distribution is basically the same across all ages.

With these simple vectors summarizing humans and chimpanzees variation across ages, you’re ready to plot. The medians (hpm and ppm in the code above) can simply be plotted against age using the plot() and lines() functions, simple enough. But the shaded-in 95% quantiles have to be made using the polygon() function, which creates a shape (a polygon) by connecting sets of points that have to be entered confusingly: two sets of x-coordinates with the first in normal order and the second reversed, and two sets of y-coordinates with the first in normal order and the second reversed.

Plot yourself down and have a beer.

Plot yourself down and have a beer.

In our case, the first set of x coordinates is the vector of sorted, unique ages (h and p in the code), and the second set is the same vector but in reverse. The first set of y coordinates is the vector of 97.5% quantiles (hpu and ppu), and the second set is the vector of 0.025% quantiles in reverse. You can play around with ranges of colors and transparency with “col=….”

What I like about the second plot is that it clearly summarizes the ranges of variation for humans and chimps, and highlights which parts of the ranges overlap: the human and ape medians are comparable at the youngest ages, but by 6 months the human median is pretty much always above the chimpanzee upper range. The gorilla points are generally close to the chimpanzee median until around 2 years after which gorilla size increase basically stops but chimpanzees continue. Importantly, we can also see at what ages the simulated H. erectus values are most similar to the empirical species values, and when they fall out of species’ ranges. As I pointed out a bajillion years ago, the H. erectus values (based on the Mojokerto juvenile fossil) encompass most living species’ values around six months to two years.

I also like that second plot does all the above, and still honestly shows the jagged messiness that comes with cross-sectional, resampled data. Of course no individual’s proportional brain size increases and decreases so haphazardly during growth as depicted in the plot. It’s ugly but it’s honest. But if you like lying to yourself about the nature of your data, if you prefer curvy, smoothed inference to harsh, gritty reality, you can resort to the third plot above: the loess regression lines calculated from the resampled data.

Loess and lowess (not to be confused with loess) refer to locally weighted regression scatterplot smoothing, a way to model gross data like we have, but with a nice and smooth (but not straight) line. Because R is awesome, it has a loess() function built right in. The function easily does the math, and you can quickly obtain confidence intervals for the modelled line, but plotting these is another story. After scouring the internet, coding and failing (repeatedly) I finally came up with this:

Screen Shot 2014-07-26 at 6.57.01 PM

Creating vectors of points makes your lines clean and smooth.

If you simply try to plot a loess() line based on 1000s of unordered points, you’ll get a harrowing spider’s web of lines between all the points. Instead, you need to create ordered vectors of the non-repeated modelled points (hlm, plm, glm, above) and their upper and lower confidence limits. Once modelled, you can simply plot the lines and create polygons based on the confidence intervals as above.

The best way to learn to do stuff in R is to just play around with data and code until you figure out how to do whatever it is you have in mind. If you want to recreate, or alter, what I’ve described here, you can download the resampled data (link at the beginning of the post) and R code. Good luck!

Update: Brain growth in Homo erectus, and the age of the Mojokerto fossil

The Mojokerto calvaria. You’re looking at the left side of the
 skull: the face would be to the left. Check it out in 3D here.

A few months ago I posted an abridged version of the presentation I gave at this year’s meetings of the American Association of Physical Anthropologists, about brain growth in Homo erectus. This study, co-authored with Jeremy DeSilva, adopts a novel approach (see “Methods” in that earlier post) to analyze the Mojokerto fossil (right). The specimen is the only H. erectus non-adult complete enough to get a decent estimate of brain size (or rather, the overall volume of the brain case) – probably 630 to 660 cubic centimeters (Coqueugniot et al. 2004; Balzeau et al., 2004). So to study brain growth in the extinct species, we just have to connect a range of estimated brain sizes at birth (around 290 cubic centimeters, based on predictive equations by DeSilva and Lesnik, 2008) to that of Mojokerto. But, the speed of brain growth implied by this comparison depends on how old poor Mojokerto was when s/he died.

Most recently, Hélen Coqueugniot and colleagues (2004) used CT scans of the fossil to examine the fusion of its various bones, to suggest the poor kid died between six months to 1.5 years, if not even younger. Antoine Balzeau and team (2005) also studied scans of the fossil, and their analysis of its virtual endocast presented conflicting age estimates, but they argued the poor kid was probably no older than 4 years. Earlier studies had suggested the kid was up to 8 years. Now, for my previous post/conference presentation, we assumed the Coqueugniot estimate was correct – but what if we consider a full range of ages for Mojokerto, from 0.03-6.00 years?

Brain size, relative to newborns’ values, at different ages in humans (black circles) and chimpanzees (red triangles). Homo erectus median and mean are the thick solid and dashed blue lines, respectively, and the 90% and 95% confidence intervals are indicated by the thinner, dotted blue lines. Data are the same as in the previous post.

The plot above depicts brain size relative to newborns: each circle (humans) and triangle (chimpanzees) represents the proportional size difference between a newborn (less than 1 week) and an older individual, up to 6 years. Obviously, relative brain size gets bigger in humans and chimpanzees over time. Interestingly, even though humans and chimps have very different brain sizes, the proportional brain size changes overlap a lot between species, especially at younger ages. Ah, the joys of cross-sectional samples.

But what’s especially interesting here are the blue lines on the graph, indicating estimates of proportional size change in Homo erectus, assuming Mojokerto’s skull could hold 630 cc of delicious brain matter, and that the species’ skulls at birth could hold about 290 cc, give or take several cc. The thick solid and dashed lines just above 2 on the y-axis are the mean and median of our estimates – Mojokerto’s brain averages around 2.2 times larger than predicted newborns. Such a proportion is most likely to be found in humans between 6 months to a year of age, and in chimpanzees between around 6 months and 2 years. The confidence intervals, the highest and lowest bounds of our estimates for Homo erectus proportional size change, are the thinner dashed lines on the graph. They help us constrain our estimates, and further suggest that the proportional difference found for H. erectus is most likely to be found in either chimpanzees or humans around 1 year of age – just like Coqueugniot and colleagues predicted!!!

Thus, independent evidence – brain size of Mojokerto and estimated brain size at birth in Homo erectus – corroborates a previously estimated age at death for the Mojokerto fossil, the poor little Homo erectus baby. This further supports our estimates of brain growth rates in this species, as described in the previous post.

ResearchBlogging.orgSo to summarize, fairly scant fossil evidence compared with larger extant species samples using randomization statistics, argue for high, human-like infant brain growth rates in Homo erectus by around 1 million years ago. Our ancestors were badasses.

Remember, if you want the R code I wrote to do this study, just lemme know!

Those references
Balzeau A, Grimaud-Hervé D, & Jacob T (2005). Internal cranial features of the Mojokerto child fossil (East Java, Indonesia). Journal of human evolution, 48 (6), 535-53 PMID: 15927659

Coqueugniot H, Hublin JJ, Veillon F, Houët F, & Jacob T (2004). Early brain growth in Homo erectus and implications for cognitive ability. Nature, 431 (7006), 299-302 PMID: 15372030

DeSilva JM, & Lesnik JJ (2008). Brain size at birth throughout human evolution: a new method for estimating neonatal brain size in hominins. Journal of human evolution, 55 (6), 1064-74 PMID: 18789811

Pre-publication: Brain growth in Homo erectus (plus R code!)

The annual meetings of the American Association of Physical Anthropologists were going on all last week, and I gave my first talk before the Association (co-authored with Jeremy DeSilva). The talk focused on using resampling methods and the abysmal human fossil record to assess whether human-like brain size growth rates were present in our >1 mya ancestor Homo erectus. This is something I’ve actually been sitting on for a while, and wanted to wait til after the talk to post for all to see. I haven’t written this up yet for publication, but before then I’d like to briefly share the results here.

Background: Humans’ large brains are critical for giving us our unique capabilities such as language and culture. We achieve these large (both absolutely, and relative to our body size) brains by having really high brain growth rates across several years; most notable are exceptionally high, “fetal-like” rates during the first 1-2 years of life. Thus, rapid brain growth shortly after birth is a key aspect of human uniqueness – but how ancient is this strategy?

Materials: We can plot brain size at birth in humans and chimpanzees (our closest living relatives) to visualize what makes humans stand out (Figure 1).

Figure 1. Brain size (volume) at given ages. Humans=black, chimpanzees=red. Ranges of brain size at birth, and the chronological age of the Mojokerto fossil, in blue.

Human data come from Cogueugniot and Hublin (2012), and chimpanzees from Herndon et al. (1999) and Neubauer et al. (2012). The earliest fossil evidence able to address this question comes from Homo erectus. Because of the tight relationship between newborn and adult brain size (DeSilva and Lesnik 2008), we can use adult Homo erectus brain volumes (n=10, mean = 916.5 cm^3) to predict that of the species’ newborns: mean = 288.9 cm^3, sd = 17.1). An almost-recent analysis of the Mojokerto Homo erectus infant calvaria suggests a size of 663 cm^3 and an age of 0.5-1.25 years (Coqueugniot et al. 2004; this study actually suggests an oldest age of 1.5 years, but the chimpanzee sample here requires us to limit the study to no more than 1.25 years). Because we have a H. erectus fossil less than 2 years of age, and we can estimate brain size at birth, we can indirectly assess early brain growth in this species.

Methods: Resampling statistics allow inferences about brain growth rates in this extinct species, incorporating the uncertainty in both brain size at birth, and in the chronological age of the Mojokerto fossil. We thus ask of each species, what growth rates are necessary to grow one of the newborn brain sizes to any infant between 0.5-1.25 years? And from there, we compare these resampled growth rates (or rather, ‘pseudo-velocities’) between species – is H. erectus more similar to modern humans or chimpanzees? There are 294 unique newborn-infant comparisons for humans and 240 for the chimpanzee sample. We therefore compare these empirical newborn-infant pairs from extant species to 7500 resampled H. erectus pairs, randomly selecting a newborn H. erectus size based on the parameters above, and randomly selecting an age from 0.5-1.25 years for the Mojokerto specimen. This procedure is used to compare both absolute size change (the difference between an infant and a newborn size, in cm^3/year), and and proportional size change (infant/newborn size).

Results: Humans’ high early brain growth rates after birth are reflected in the ‘pseudovelocity curve’ (Figure 2). Chimps have a similar pattern of faster rates earlier on, but these are ultimately lower than humans’. Using the Mojokerto infant’s brain size (and it’s probable ages) and the likely range of H. erectus neonatal brain sizes (mean = 288, sd = 17), it is fairly clear that H. erectus achieved its infant brain size with high, human-like rates in brain volume increase.

Figure 2. Brain size growth rates (‘pseudo-velocity’) at given ages. Humans=black, chimpanzees=red, and Homo erectus,=blue.

However, if we look at proportional size change, the factor by which brain size increases from birth to a given age, we see a great deal of overlap both between age groups within a species, and between different species. Cross-sectional data create a great deal of overlap in implied proportional size change between ages within a species; it is easier to consider proportional size change between taxa, conflating ages, then  (Figure 3). Humans show a massive amount of variation in potential growth rates from birth to 0.5-1.25 years, and chimpanzees also show a great deal of variation, albeit generally lower than in the human sample. Relative growth rates in Homo erectus are intermediate between the two extant species.

Figure 3. Proportional brain size increase (infant/newborn size).

Significance: Brain size growth shortly after birth is critical for humans’ adaptative strategy: growing a large brain requires a lot of energy and parental (especially maternal) investment (Leigh 2004). Plus, in humans this rapid increase may correspond with the creation of innumerable white-matter connections between regions of the brain (Sakai et al. 2012), important for cognition or intelligence. The H. erectus fossil record (1 infant and 10 adults) provides a limited view into this developmental period. However, comparative data on extant animals (e.g. brain sizes from birth to adulthood), coupled with resampling statistics, allow inferences to be made about brain growth rates in H. erectus over 1 million years ago.

Assuming the Mojokerto H. erectus infant is accurately aged (Coqueugniot et al. 2004), and that Homo erectus followed the same neonatal-adult scaling relationship as other apes and monkeys (DeSilva and Lesnik 2008), it is likely that H. erectus had human-like rates of absolute brain size growth. Thus, the energetic and parental requirements to raise such brainy babies, seen in modern humans, may have been present in Homo erectus some 1.5 million years ago or so. This may also imply rapid white-matter proliferation (i.e. neural connections) in this species, suggesting an intellectually (i.e. socially or linguistically) stimulating infancy and childhood in this species. At the same time, relative brain size growth appears to scale with overall brain size: larger brains require proportionally higher growth rates. This is in line with studies suggesting that in many ways, the human brain is a scaled-up version of other primates’ (e.g. Herculano-Houzel 2012).

ResearchBlogging.org
This study was made possible with published data, and the free statistical programming language R.

Contact me if you want the R code used for this analysis, I’m glad to share it!

References
Coqueugniot H, Hublin JJ, Veillon F, Houët F, & Jacob T (2004). Early brain growth in Homo erectus and implications for cognitive ability. Nature, 431 (7006), 299-302 PMID: 15372030

Coqueugniot H, & Hublin JJ (2012). Age-related changes of digital endocranial volume during human ontogeny: results from an osteological reference collection. American journal of physical anthropology, 147 (2), 312-8 PMID: 22190338

DeSilva JM, & Lesnik JJ (2008). Brain size at birth throughout human evolution: a new method for estimating neonatal brain size in hominins. Journal of human evolution, 55 (6), 1064-74 PMID: 18789811

Herculano-Houzel S (2012). The remarkable, yet not extraordinary, human brain as a scaled-up primate brain and its associated cost. Proceedings of the National Academy of Sciences of the United States of America, 109 Suppl 1, 10661-8 PMID: 22723358

Herndon JG, Tigges J, Anderson DC, Klumpp SA, & McClure HM (1999). Brain weight throughout the life span of the chimpanzee. The Journal of comparative neurology, 409 (4), 567-72 PMID: 10376740

Leigh SR (2004). Brain growth, life history, and cognition in primate and human evolution. American journal of primatology, 62 (3), 139-64 PMID: 15027089

Neubauer, S., Gunz, P., Schwarz, U., Hublin, J., & Boesch, C. (2012). Brief communication: Endocranial volumes in an ontogenetic sample of chimpanzees from the taï forest national park, ivory coast American Journal of Physical Anthropology, 147 (2), 319-325 DOI: 10.1002/ajpa.21641

Sakai T, Matsui M, Mikami A, Malkova L, Hamada Y, Tomonaga M, Suzuki J, Tanaka M, Miyabe-Nishiwaki T, Makishima H, Nakatsukasa M, & Matsuzawa T (2012). Developmental patterns of chimpanzee cerebral tissues provide important clues for understanding the remarkable enlargement of the human brain. Proceedings. Biological sciences / The Royal Society, 280 (1753) PMID: 23256194