The short answer is, “Not really.” But as is often the case, the real story behind so many headlines last week is a bit more complicated.

What are they talking about, Willis?
These headlines, each saying something slightly different, are referring to a study by Indjeian and colleagues published in Cell. Researchers identified a stretch of DNA that is highly conserved across mammals, or in other words, it is very similar between very different organisms. In humans, however, this conserved region is actually missing (“hCONDEL.306”):

Fig. 4A from Indjeian et al. 2016. A stretch of DNA on Chromosome 8, “hCONDEL.306,” is very similar between chimpanzees, macaque monkeys, and mice, but is completely missing in humans (as is another stretch, hCONDEL.305).
That a stretch of DNA should be highly conserved across diverse animal groups suggests purifying natural selection has prevented any mutations from occurring here – alterations to this stretch of DNA negatively affected fitness. But that humans should be missing such a highly conserved region suggests that this deletion came under positive natural selection at some point in human evolution. This strategy, of seeking stretches of DNA that are similar between many animals but very different in humans, has led to the identification of hundreds of genetic underpinnings of human uniqueness. Some of these, such as the case in question, involve deleted sequences and have been termed “hCONDELs,” for “regions with high sequence conservation that are surprisingly deleted in humans” (McLean et al., 2011: 216). Others involve the accumulation of mutations where other animals show few or none (e.g., HACNS1; Prabhakar et al. 2008). In many (most?) cases these are “non-coding” sequences of DNA.
How can “non-coding” DNA help make humans upright?
As was predicted 30 years ago (King and Wilson, 1975), what makes humans different from other animals isn’t so much in the protein-coding DNA (the classical understanding of the term, “genes”), but rather in the control of these protein-coding genes. “Non-coding” means that a stretch of DNA may get transcribed into RNA but is not then translated into proteins. But even though these sequences themselves don’t become anything tangible, many are nevertheless critical in regulating gene expression – when, where and how much a gene gets used. It’s wild stuff. Indeed, “Many human accelerated regions are developmental [gene] enhancers” (Capra et al., 2013).
In the present case, hCONDEL.306 refers to the human-specific deletion of a developmental enhancer located near the GDF6 gene, which is a bone morphogenetic protein. The major finding of the paper, as stated succinctly in the Highlights title page, is that “Humans have lost a conserved regulatory element [hCONDEL.306] controlling GDF6 expression…. Mouse phenotypes suggest that [this] deletion is related to digit shortening in human feet.”
How do they link this “gene tweak” to digit shortening?
Since humans have lost this gene enhancer that is highly conserved in other mammals, Indjeian and team reasoned that the chimpanzee DNA sequence associated with this deletion, retaining the enhancer sequence, is likely the ancestral condition from which the human version evolved. They inserted the chimpanzee version into mouse embryos and watched what happened as they developed. The enhancer was only active in the mice’s back legs, specifically in the cartilage that would later become the lateral toe bones and cells that would become a muscle of the big toe (abductor hallucis). These are areas where humans and chimpanzees differ: our lateral toes are shorter than chimps’, and we only have one abductor hallucis muscle whereas chimpanzees have an additional, longer abductor hallucis (Aiello and Dean, 2002). So, we’re on our way to seeing how hCONDEL.306 might relate to our big toe or upright walking, as the headlines say.
But this still doesn’t explain how this deletion affects GDF6 gene expression, and therefore what this does for our feet. Pressing onward, the scientists compared the size of certain bones in mice with a normal Gdf6 gene, and those in which the Gdf6 gene was completely turned off (or “knocked out”). The Gdf6 knock-out mice had shorter lateral toe bones than regular mice, but they also had shorter big toes as well – the previous experiment staining mouse embryos showed the ancestral enhancer was expressed more in the latter toes, not so much the big toe.
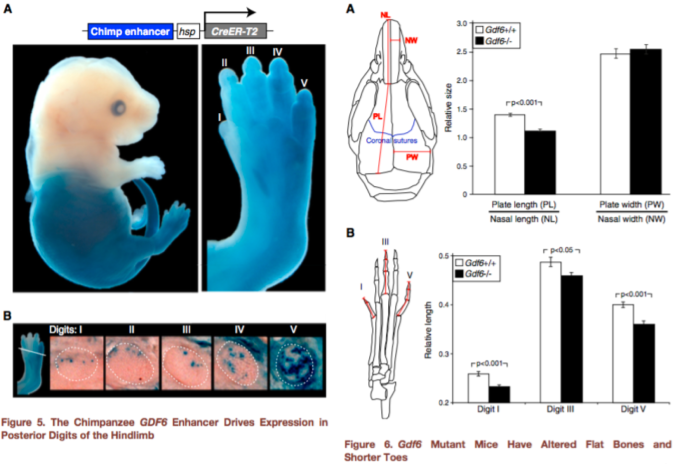
Figures 5-6 from Indjeian et al. (2016) sum up the findings. Figure 5 (left) shows that the ancestral version of the GDF6 enhancer (blue staining) is most strongly expressed in the lower half of the body, especially the fifth toe bone. Figure 6 (right) shows that a lack of Gdf6 expression (black bars) results in shorter skull and toe bones. Combining these findings, humans lack a gene enhancer associated with the development of long lateral toes.
hCONDEL.306 doesn’t completely turn off GDF6, so this second experiment doesn’t really tell us exactly what the hCONDEL does. But the results are highly suggestive. Indjeian and team showed that Gdf6 affects toe length, among other skeletal traits, in mice. The ancestral enhancer that humans are missing seems to affect GDF6 activity in the leg/foot only. This illustrates a mechanism of modularity – as the authors state, “Loss of this enhancer would thus preserve normal GDF6 functions in the skull and forelimbs, while confining any … changes to the posterior digits of the hindlimb.” In other words, developmental enhancers allow different parts of the body to evolve independently despite being made by some of the same genes (such as GDF6).
As with any good study, results are intriguing but they raise more questions for future studies. The researchers conducted two experiments to investigate the function of hCONDEL.306: first putting the chimp version in mouse embryos to see where the ancestral enhancer is expressed, and then turning off Gdf6 completely in mice to see what happens. A more direct way to see what hCONDEL.306 does might be to put a longer stretch of the human sequence surrounding GDF6 containing (or rather missing) the ancestral enhancer into mouse embryos. I’m not a molecular biologist so maybe this isn’t possible. But this is important because the ancestral (chimpanzee) enhancer appeared to be most strongly expressed in the little toe, but of course this isn’t our only toe that is short compared to chimps. Similarly, how hCONDEL.306 relates to the abductor hallucis muscle remains in question – does it reduce the size of the intrinsic muscle present in both humans and chimps, or does it prevent development of the longer muscle that chimps have but we lack? We can expect to find hCONDEL.306 in the genomes of Neandertals (and Denisovans?), since they also have short toes, but what would it mean if they retained the ancestral enhancer?
So how does this gene tweak help with upright walking?
This is a really cool paper with important implications for human evolution, but something seems to have been lost in translation between the paper and the headlines (the news pieces themselves are good, though). The upshot of the study is that humans lack a stretch of non-coding DNA, which in chimpanzees (or chimp-ified mice) promotes embryonic development of the lateral toes and a big toe muscle. This may be a genetic basis for at least some aspects of our unique feet that have evolved under natural selection for walking on two legs.
But the headlines misrepresent this result, with words like “led to,” “allowed,” and “caused,” especially when these are followed by “big toe” or “upright walking.” hCONDEL.306 doesn’t really have anything to the big toe bone itself, although it might relate to a muscle affecting our big toe. The only sense in which the “Gene tweak led to humans’ big toe” (first title above) is that hCONDEL.306 might be responsible for our short lateral toes, which make our first toe look big by comparison. The other headlines are misleading since we know from fossil evidence that hominins walked upright long before we have evidence for short toes:

These little piggies get none. Fourth toe bones of living apes and humans (left) and (probable) hominins from 3-5 million years ago (right). I did my best to get all images to scale.
“Epigenetic,” from the fourth article headline, is simply wrong. Modern day epigenetics is a field concerned with the chemical alterations to the structure of DNA. Even the broad concept of epigenetic as originally devised by Conrad Waddington was about how environments (cellular or outside the body) influence development.
![]() It’s hard to fit all the important and interesting information from scientific papers into news headlines. Still, it would be good if headlines more accurately portrayed scientific findings, especially avoiding such definitive verbs as “caused.” Especially in the realm of biology, people should know that there’s a lot that we still don’t know, that there’s lots more important work left to be done.
It’s hard to fit all the important and interesting information from scientific papers into news headlines. Still, it would be good if headlines more accurately portrayed scientific findings, especially avoiding such definitive verbs as “caused.” Especially in the realm of biology, people should know that there’s a lot that we still don’t know, that there’s lots more important work left to be done.
References
Aiello and Dean, 2002. Human Evolutionary Anatomy. Academic Press.
Capra et al., 2013. Many human accelerated regions are developmental enhancers. Philosophical Transactions of the Royal Society B 368: 20130025.
Indjeian et al. 2016. Evolving new skeletal traits by cis-regulatory changes in bone morphogenetic proteins. Cell http://dx.doi.org/10.1016/j.cell.2015.12.007
King and Wilson, 1975. Evolution at two levels in humans and chimpanzees. Science 188: 107-116 DOI: 10.1126/science.1090005
McLean et al., 2011. Human-specific loss of regulatory DNA and the evolution of human-specific traits. Nature 471: 216-219.
Prabhakar et al., 2008. Human-specific gain of function in a developmental enhancer. Science 321: 1346-1350.