Osteology Everywhere: Skull in the Stone #FossilFriday edition

It’s that time of year again.

233313fc41ee3a63_tumblr_mgdqksndiz1ro7sbfo1_400-xxxlarge

It’s the end of the year and I’ve got Homo erectus on the brain somethin fierce. Our precedent-erect first popped up in Africa around 1.9 million years ago, quickly spread throughout much of the Old World, and persisted until perhaps as late as ~ 100,000 years ago in Java, Indonesia. This was a very successful species by all accounts, and as a result of its great range and duration, you can imagine it was also pretty variable.

screen-shot-2016-12-23-at-3-26-15-pm

Hominin brain sizes. Boxes and whiskers represent sample tendencies and points are individual specimens. 1 = Australopithecus, 2 = Early Homo (cf. habilisrudolfensis), 3 = Dmanisi H. erectus, 4 = Early African H. erectus, 5 = Early Indonesian H. erectus, 6 = Chinese H. erectus, 7 = Later Indonesian H. erectus, 8 = modern humans.

Despite this great variation, H. erectus skulls generally share a common visage: long and low cranial vault, low forehead, protruding brow ridges, fun tuberosities and tori in the back. You’d recognize them anywhere. Including the sidewalk!

20161220_202353.jpg

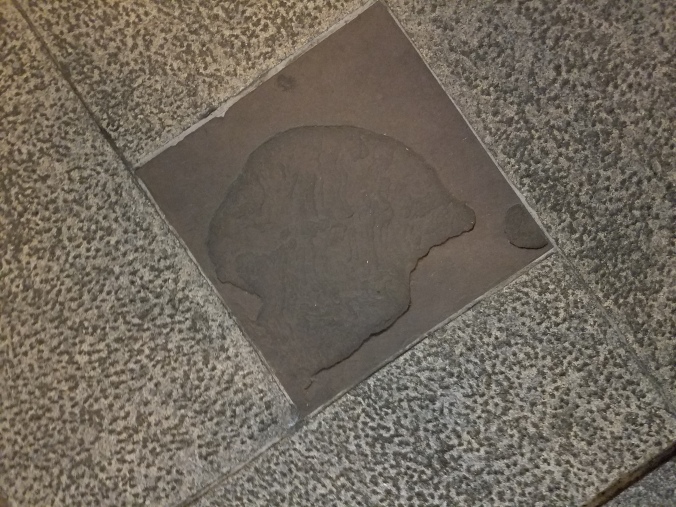
Homo erectus in front of Ploenchit Tower, Bangkok (lateral view, front is to the right).

The relief in this sidewalk slat superficially looks like a trace fossil of partial H. erectus cranium, the face either missing (from the lower right) or taphonomically displaced toward the left side of the tile (see here for actual H. erectus trace fossils). This looks really similar to H. erectus from Indonesia, not surprising given its discovery in Thailand. Why, it could have come straight out of Figure 6 from a 2006 paper by Yousuke Kaifu and colleagues:

Bangkok erectus.png

Left lateral views of Javanese H. erectus crania, modestly modified from Kaifu et al. (2006: Fig. 6). Front is to the left this time.

Using my insane photo editing skills, I’ve inserted the Ploenchit Tower trace fossil (reversed) within the horde of heads presented by Kaifu et al., above. Like many of the real fossils, the Ploenchit specimen is missing the face (due to taphonomy), the supraorbital torus or brow ridge juts out from a low-rising forehead, and the occipital bone also projects out about from the otherwise rounded contour of the cranium. Note that there is a good deal of variation in each of these features among the real fossils.

What a happy holiday accident to find a Homo erectus cranium on the street!

seinfeld-its-a-festivus-miracle

ResearchBlogging.org Reference
Kaifu Y, Aziz F, Indriati E, Jacob T, Kurniawan I, & Baba H (2008). Cranial morphology of Javanese Homo erectus: new evidence for continuous evolution, specialization, and terminal extinction. Journal of human evolution, 55 (4), 551-80 PMID: 18635247

Did Neandertal brains grow like humans’ or not?

According to Marcia Ponce de Leon and colleagues, “Brain development is similar in Neandertals and modern humans.” They reached this conclusion after comparing how the shape of the brain case changes across the growth period of humans and Neandertals. This finding differs from earlier studies of Neandertal brain shape growth (Gunz et al. 2010, 2012).

Although Neandertals had similar adult brain sizes as humans do today, the brains are nevertheless slightly different in shape:

Screen Shot 2016-07-26 at 4.31.52 PM

Endocranial surfaces of a human (left, blue) and Neandertal (right, red), from Gunz et al. (2012). These surfaces reflect the size and shape of the brain, blood vessels, cerebrospinal fluid, and meninges.

Gunz et al. (2010, 2012) previously showed that endocranial development in humans, but not in Neandertals or chimpanzees, has a “globularization phase” shortly after birth: the endocranial surface becomes overall rounder, largely as a result of the expansion of the cerebellum:

Screen Shot 2016-07-26 at 4.38.39 PM

Endocranial (e.g., brain) shape change in humans (blue), Neandertals (red) and chimpanzees (green), Fig. 7 from Gunz et al. (2012). Age groups are indicated by numbers. The human “globularization phase” is represented by the great difference in the y-axis values of groups 1-2 (infants). The Neandertals match the chimpanzee pattern of shape change; Neandertal neonates (LeM2 and M) do not plot as predicted by a human pattern of growth.

Ponce de Leon and colleagues now challenge this result with their own similar analysis, suggesting similar patterns of shape change with Neandertals experiencing this globularization phase as well (note that endocranial shapes are always different, nevertheless):

Screen Shot 2016-07-26 at 4.47.13 PM

Endocranial shape change in humans (green) and Neandertals (red), from Ponce de Leon et al. (2016). Note that the human polygons and letters represent age groups, whereas the Neandertal polygons and labels are reconstructions of individual specimens.

The biggest reason for the difference between studies is in the fossil sample. Ponce de Leon et al. have a larger fossil sample, with more non-adults including Dederiyeh 1-2, young infants in the age group where human brains become more globular.

Screen Shot 2016-07-26 at 5.01.17 PM

Comparison of fossil samples between the two studies.

But I don’t think this alone accounts for the different findings of the two studies. Overall shape development is depicted in PC 1: in general, older individuals have higher PC1 scores. The globularization detected by Gunz et al. (2010; 2012) is manifest in PC2; the youngest groups overlap entirely on PC1. The biggest difference I see between these studies is where Mezmaiskaya, a neonate, falls on PC2. In the top plot (Gunz et al., 2012), both Mezmaiskaya and the Le Moustier 2 newborn have similar PC2 values as older Neandertals. In the bottom plot (Ponce de Leon et al., 2012), the Mezmaiskaya neonate has lower PC2 scores than the other Neandertals. Note also the great variability in Mezmaiskaya reconstructions of Ponce de Leon et al. compared with Gunz et al.; some of the reconstructions have high PC2 values which would greatly diminish the similarity between samples. It’s also a bit odd that Engis and Roc de Marsal appear “younger” (i.e., lower PC1 score) than the Dederiyeh infants that are actually a little bit older.

Ponce de Leon et al. acknowledge the probable influence of fossil reconstruction methods, and consider other reasons for their novel findings, in the supplementary material. Nevertheless, a great follow-up to this, to settle the issue of Neandertal brain development once and for all, would be for these two research teams to join forces, combining their samples and comparing their reconstructions.

REFERENCES

ResearchBlogging.org

Gunz P, Neubauer S, Maureille B, & Hublin JJ (2010). Brain development after birth differs between Neanderthals and modern humans. Current Biology : 20 (21) PMID: 21056830

Gunz P, Neubauer S, Golovanova L, Doronichev V, Maureille B, & Hublin JJ (2012). A uniquely modern human pattern of endocranial development. Insights from a new cranial reconstruction of the Neandertal newborn from Mezmaiskaya. Journal of Human Evolution, 62 (2), 300-13 PMID: 22221766

Ponce de León, M., Bienvenu, T., Akazawa, T., & Zollikofer, C. (2016). Brain development is similar in Neanderthals and modern humans Current Biology, 26 (14) DOI: 10.1016/j.cub.2016.06.022

Bioanthro lab activity: Sexual dimorphism

A few weeks ago we examined sexual dimorphism – characteristic differences between males and females – in my Intro to Bioanthro class. Sexual dimorphism roughly correlates with aspects of social behavior in animals, and so we compared dimorphism in our class with what is seen in other primates. For the lab, we collected our body masses, heights, and lengths of our 2nd and 4th fingers, then I plotted the data and we went over it together.

When collecting data on your students, make sure to get permission from your institution and let students know they can opt out of sharing their personal data. I’ve also assigned students randomized ID numbers to help keep their data private and as anonymous as possible.

This activity builds on the first lab we did this year, measuring our head circumferences to estimate brain size and examining how this varies within the classroom. We saw then that our class’s males have  larger brain (well, head) sizes than females. We hypothesized that this was simply due to body size differences – all else being equal, larger people should have larger brains. Now that we collected body mass data, we could test this hypothesis – in fact, when body mass is taken into account, our class’s females have larger brains than males:

Sexual dimorphism in brain size (left), body size (center), and brain/body size.

Sexual dimorphism in brain size (left), body size (center), and brain size relative to body size (right).

These are sex differences based on raw numbers. Another way to look at dimorphism is to se the extent to which sexes deviate from a scaling relationship (“allometry”). Looking to the left plot below, there is a positive linear relationship between body and brain size: as body size increases, so does brain size. As we saw above, male values are elevated above females’ but there is overlap. Importantly, the right plot shows that deviations from this linear trend, quantified as residuals, are not significantly different for the two sexes. So even though females have large brains relative to their body size in absolute terms, this is not exceptional given how brain size scales with body size.

Brain-body allometry in our classroom. Males and females in our classroom do not seem to deviate appreciably from a common pattern of allometry.

Brain-body allometry in our classroom. Males and females in our classroom do not seem to deviate appreciably from a common pattern of allometry.

While lab activities help students to understand patterns in data, this lab also shows students the importance of comparing patterns of variation.  Students learn from readings and lectures that humans show relatively low levels of dimorphism, and this activity helps them see why we say that. Situating our data within the context of primate dimorphism and mating systems, they can ask if there is an adaptive or evolutionary significance behind our level of dimorphism.

Sexual dimorphism in our classroom compared with what is seen in primates with different mating systems and levels male-male competition. Our class values are the stars, and in the right plot blue is males and green is females. Figures from Plavcan (2012) and Nelson & Schultz (2010).

Sexual dimorphism in our classroom compared with what is seen in primates with different mating systems and levels male-male competition. Our class values are the stars, and in the right plot blue is males and green is females. Figures from Plavcan (2012) and Nelson & Schultz (2010).

In this broader comparative context, students tackle what it means for human dimorphism, and ratios of the 2nd digit/4th digit, to be intermediate between what we see in monogamous vs. non-monogamous primates. This can lead some interesting class discussion.

Handout: Lab 3-Sexual dimorphism (Instructions and questions)

ResearchBlogging.orgReferences
 Nelson E, & Shultz S (2010). Finger length ratios (2D:4D) in anthropoids implicate reduced prenatal androgens in social bonding. American Journal of Physical Anthropology, 141 (3), 395-405. PMID: 19862809

Plavcan JM (2012). Sexual size dimorphism, canine dimorphism, and male-male competition in primates: where do humans fit in? Human Nature, 23 (1), 45-67. PMID: 22388772

2015 AAPA conference: More brain growth

The American Association of Physical Anthropologists is holding its annual meeting next year in St. Louis, in my home state of Missouri (I’m from Kansas City, which is by far the best city in the state, if not the entirety of the Midwest). I’ll be giving a talk comparing brain size growth in captive and wild chimpanzees, on Saturday 28 March in the Primate Life History session. Here’s a sneak peak:

Velocity curve for brain size from birth to 5 years in wild (green) and caprive (blue) chimpanzees. For the captive models, the dashed line is fit to the raw brain masses, and the solid line is fit to the estimated endocranial volumes.

Velocity curves for brain size growth from birth to 5 years in wild (green) and captive (blue) chimpanzees. The wild data are endocranial volumes, but the captive specimens are represented by brain masses. So the captive data are modeled for both the original masses (dashed) and estimated volumes (solid). Wild data are from Neubauer et al. 2011, captive data from Herndon et al., 1999.

Abstract: This study compares postnatal brain size change in two important chimpanzee samples: brain masses of captive apes at the Yerkes National Primate Research Center, and endocranial volumes (ECVs) of wild-collected individuals from the Taï Forest. Importantly, age at death is known for every individual, so these cross-sectional samples allow inferences of patterns and rates of brain growth in these populations. Previous studies have revealed differences in growth and health between wild and captive animals, but such habitat effects have yet to be investigated for brain growth. It has also been hypothesized that brain mass and endocranial volume follow different growth curves. To address these issues, I compare the Yerkes brain mass data (n=70) with the Taï ECVs (n=30), modeling both size and velocity change over time with polynomial regression. Yerkes masses overlap with Taï volumes at all ages, though values for the former tend to be slightly elevated over the latter. Velocity curves indicate that growth decelerates more rapidly for mass than ECV. Both velocity curves come to encompass zero between three and four years of age, with Yerkes mass slightly preceding Taï ECV. Thus, Yerkes brain masses and Taï ECVs show a very similar pattern of size change, but there are minor differences indicating at least a small effect of differences in habitat, unit of measurement, or a combination of both. The overall similarity between datasets, however, points to the canalization of brain growth in Pan troglodytes.

Can ‘ape-like’ actually be ‘human-like’?

I’m reading up on life history in Homo erectus for a few projects I’m working on, and something’s just caught my eye. A 2012 issue of Current Anthropology presents a series of papers from the 2011 symposium, “Human Biology and the Origins of Homo.” This issue is full of great stuff, and to top it all off, it can be accessed online for free! (here’s the JSTOR link)

Gary Schwartz has a paper here recounting what is known (or as he stresses, what is still largely unknown) about growth and life history in early Homo. Dental evidence accumulated over the past 30 years has pointed to a rapid (ape-like) life cycle for fossil hominins, in comparison with a slow, long and drawn out human pattern. But much of the evidence against a human-like pattern is somewhat indirect. For instance, Holly Smith (1991) has shown that there’s a pretty tight relationship between brain size and age at first molar (M1) eruption in Primates:

M1 crancap

Fig. 1 from Schwartz (2012). “Bivariate plot of ln M1 emergence age in months (y) versus ln cranial capacity in cubic centimeters (x) for a sample of anthropoids.” The hominins and humans are the open shapes, to which I’ve visually fitted the red line.

It’s a very high correlation (r=0.98). This means that armed with simply an animal’s cranial capacity, which is fairly easy to estimate given complete enough fossils, one can estimate with a bit of confidence its likely age range for M1 emergence. With brain sizes between apes’ and ours, fossil hominins can be estimated to have erupted their M1s at younger ages than us. Many subsequent studies of tooth formation, based on the microscopic remnants of tooth development, have supported these inferences. So presumably, faster, ape-like dental development could be extrapolated to mean ape-like body growth rates and other aspects of life history as well.

But although this is a tight relationship, there are deviations. As Schwartz notes in the article, and others have noted before, high correlations found when examining large interspecific groups (e.g., primates as a whole) often break down when the focus is on smaller groups of more closely related species (e.g., just apes). Based on the relationship figured above, humans are expected to erupt M1 around 7 years of age, but nearly all humans erupt M1 closer to 6 years (hence the open diamond for humans is below the regression line). What hominins appear to share in common with humans is a younger age at M1 eruption than expected for primates of their brain sizes (the red line I’ve added to the figure).

Hominins’ faster dental development and eruption may be ape-like in absolute terms, but eruption ages may be human-like when their brain size is taken to account. As with many life history variables, the significance of this similarity (if anything) is difficult to ascertain.

The small, big new Dmanisi skull

The 5th skull early Homo skull from the site of Dmanisi was announced last week. The skull was discovered nearly 10 years ago, but is finally (and very comprehensively) published in Science (Lordkipanidze et al. 2013). The ‘new’ D4500 cranium goes with the massive D2600 mandible, making this the earliest and most complete skull of Homo that I know of. It’s really a remarkable specimen, for a number of reasons beyond its age and completeness. I’ve been busy traveling, teaching and writing lately, so I haven’t yet gotten to pore over the details as much as I’d like. So I hope to sporadically post thoughts on this badass new skull as they come to me. In the mean time, several of what I’d consider the top biology/anthropology blogs*** have discussed the skull, so do check those out if you haven’t already.

The first thing I noted about D4500 is its small brain size, estimated at a mere 546 cubic centimeters. For perspective, D4500 is the green point in the following plot showing brain size in early human evolution:

Endocranial volume for various fossil hominin fossils. 1: Australopithecus afarensis, africanus & boisei; 2: Dmanisi specimens; 3: "habilines" 4: early African Homo erectus; 5: Indonesian and Chinese Homo erectus

Endocranial volume for various fossil hominin fossils. 1: Australopithecus afarensis, africanus & boisei; 2: Dmanisi specimens; 3: “habilines” 4: early African Homo erectus; 5: Indonesian and Chinese Homo erectus. D4500 is green with envy.

I got to see (but not study) the cranium a few years ago when I was helping with the Dmanisi Paleoanthropology field school, and I remember noting just how “robust” the specimen was – big mastoid processes, prominent and thick brow ridge, huge attachments for the neck muscles. In humans, and presumably our fossil forebears, these features are more developed in males than females, and so presumably D4500 was a male (consistent with the huge, associated D2600 mandible). In many primates, and 4 to ~1 mya hominins so far as we can tell, males are larger than females. So it is surprising that a robust probable male cranium is in fact not only the smallest in the Dmanisi sample, but also at the low end of early African Homo (i.e. habilis or rudolfensis), comparable to the largest australopiths. Of course, the only other faces known from Dmanisi are either not fully grown (D2700 and D2282) or old and decrepit (D3444), so perhaps the larger-brained specimens would have been at least as robust as D4500. An untestable hypothesis!

The new skull really highlights the overlap, or continuous variation between later australopiths and early Homo known also from eastern Africa. In association with the postcranial remains known from Dmanisi, the authors the paper posit that early Homo may have been distinguished from Australopithecus not so much in brain size as in body size. We could probably add body shape (limb proportions) and tool use to that list of distinguishing features, and to be sure there are Oldowan tools and small but human-like body size and shape indicated by postcrania at Dmanisi. But then, evidence for body proportions and for/against tool use in Australopithecus, especially later in the record, is somewhat equivocal…

More thoughts to follow.

*** https://blogs.wellesley.edu/vanarsdale/2013/10/17/uncategorized/the-new-wonderful-dmanisi-skull/; http://johnhawks.net/weblog/fossils/lower/dmanisi/d4500-lordkipanidze-2013.html; http://ecodevoevo.blogspot.com/2013/10/how-many-human-species-are-there-is-it.html

Reference: David Lordkipanidze, Marcia S. Ponce de León, Ann Margvelashvili, Yoel Rak, G. Philip Rightmire, Abesalom Vekua, and Christoph P. E. Zollikofer. 2013. A Complete Skull from Dmanisi, Georgia, and the Evolutionary Biology of Early Homo. Science: 342 (6156), 326-331.

Fun with Einstein’s Brain

I stumbled across a little blurb today in ScienceNow about a new study by Dean Falk (University of Michigan PhD, 1976!) about Einstein’s brain. Luckily, back in good olde 1955, when urban money was moving to suburbs and Marty McFly was trying not to screw up the future, people realized that the recently-late Einstein was a genius whose brain needed to be preserved. Fun facts that I found out:

Einstein’s brain was only 1230 cc. The average for modern people is around 1400 (Holloway 2000). Here’s a list of ancient Homo fossils, from Holloway (2000) and some others, whose cranial capacities are about the same as or greater than Einstein’s:

Zhoukoudian X (Chinese H. erectus, ~1225 cc), Ngandong 10 (Javanese H. erectus, ~1231 cc); Kabwe, LH 18, Eyasi, Saldanha, BOU-VP 16/1 (African “archaic” Homo sapiens); Narmada, Jinniushan, Yinkou (Asian “archaic” Homo sapiens); Vertesszolos 2, Reilingen, Steinheim, Swanscombge, Fontachevade, Ehringsdorf, Biache, Petralona, Atapuerca 4 (European “archaic” Homo sapiens); and most Neandertals.

This shows that, while brain size was important in the evolution of human cognition, it is not everything. I mean, how many of these hominins could begin to fathom something like special relativity? Of course, back in the Paleolithic, when life was hard and one has to worry about how to obtain food, ward off predators and persist in some sort of society, who had time for such things? On the other hand, I’m a modern human–I have no idea how large my brain is–but I can barely wrap my mind around most things in physics. So it seems that human cognition–even genius-level, such as Einstein’s–is founded in biology, but also culture and environment.

The article also suggests to me that no one really knows how the brain works. Yes, the parietal regions are associated with maths and such, and Einstein had relatively large parietal lobes. But how and why do one person’s parietal lobes confer greater math capabilities than another? (If the parietal lobes relate to mathematical ability, I might lack these)

The article also tells that Falk found a “knob-like structure” in the motor cortex, and that such “knobs” have also been associated with musical abilities. I’m not a neuroscientist, and I don’t know what these ‘knobs’ are. But it sounds like scientists kind of know what these do, since they see these structures more in people who are notable for a given talent (math, music, etc) But are these inherent in the brain and allow people these special abilities, or are they more environmental in origin, arising from certain experiences and exposures? More importantly, what do these do?! Falk also found other brain abnormalities, “that she speculates might somehow be related to Einstein’s superior ability to conceptualize physics problems.” This may well be the case, but it is still unclear why this should be so.

So I think this study is great, because it can provide neuroscientists with bases for future research on brain function and anatomy. At the same time, it underscores the fact that as smart as we humans are, we don’t yet understand how or why we are so special.

Reference

Holloway, R.L. 2000. Brain. In: Delson et al, eds. Encyclopedia of Human Evolution and Prehistory. New York: Garland Publishing, Inc. p 141-149.

Guest Post: Jerry and Julie Jive

“Good news, everyone!” to quote Prof. Farnsworth. Our good friends Jerry DeSilva and Julie Lesnik just published a paper in the Journal of Human Evolution, about neonatal brain size in primates [1]. Rather than talk and talk about it, probably missing the important stuff, I made some calls. The authors were kind enough to make a cameo appearance at Lawn Chair to talk about their paper about their paper. Thanks, Jerry and Julie! Here’s what they had to say:

Summary:

This paper presents a regression equation that can be used to calculate the size of the brain at birth in different hominin species.

Significance:

Knowing the size of the brain at birth is critical for understanding obstetric constraints and brain development throughout human evolution. Unfortunately, it is very unlikely to find fossil evidence of how big the brain was at birth in human ancestors (though see below). This paper presents a way to get around the absence of fossil evidence and calculate the size of the neonatal brain in early homs using what we know about brain development in modern primates.

Things Jerry liked about the paper:

Humans are so unusual, and in biological anthropology we often study ways in which humans are different from other primates. However, what this study finds is that humans are no different from other primates in terms of the adult/neonatal brain scaling relationship. This means that we have exactly the brain size at birth expected given the size of our brains as adults. Because of this, we can infer that our extinct ancestors and relatives also followed this ‘rule’ of adult/neonatal brain size, and can calculate the size of the brain at birth from reliable estimates of brain size in 89 adult fossil crania that have been unearthed.

I am also thrilled that Julie and I may have solved the “% brain size at birth” issue that has been all over the literature lately. Did Homo erectus have a more human-like or a more chimpanzee-like pattern of brain growth? What about australopiths? Well, we’ve found that the whole issue of % brain size at birth is simply a function of the scaling relationship between adult and neonatal brain size. Because they do not scale 1:1, but instead scale 1:0.73 (roughly), as the adult brain gets bigger, the neonatal brain gets proportionately smaller. Therefore, less of brain growth occurs in the womb as overall adult brain size increases. If you know the size of a hominin brain as an adult (which we do from the many preserved fossil crania), you can calculate the size of the brain as a baby, and then easily take a % of how much of that brain growth is achieved by birth.

Again, because of the negative allometry (m=0.73), we argue that % of brain size at birth in hominins was never “chimpanzee-like” or “human-like”, but instead followed a gradual progression from a chimpanzee-like ancestral condition to what we have today.

Things Julie liked about the paper:

So much is going on when we think about hominid evolution, especially in the early Pleistocene. With the emergence of Homo brain size is increasing, bipedality is becoming more efficient, and tool use is becoming more advanced. What I like about this paper is that understanding neonatal brain size is one way of tying all of those elements together. Humans are considered to be secondarily altricial meaning that they are born in a more underdeveloped state than their ancestors. Selection for this smaller neonatal size is often considered to be linked to the constraints placed on the pelvis by selection for more efficient bipedal locomotion. A small brain size at birth and a large adult brain always seemed exceptional for Homo. What our paper shows is that the relationship is entirely normal across anthropoids. So, where is the selective pressure? On the larger brain as an adult or on the smaller brain as a newborn? I am now more apt to lean towards larger adult brain. Efficient bipedality is important for exactly that reason; it’s efficient and therefore requires less energy to walk upright and allows the body to allot that energy to other tasks, such as maintenance of a large brain. Add tool-use advancement to the equation and it seems bigger brains and more advanced cognitive abilities were of primary importance at this stage of human evolution.

What we’d do different:

I would have included Neandertals. Julie and I made a statement in the introduction that the discovery of neonatal crania was bordering on impossible. Just days before our paper appeared on-line, however, Marcia Ponce de Leon published a fantastic paper in PNAS on a neonatal Neandertal cranium from Mezmaiskaya Cave in Russia [2]. What is very exciting to me is that this newly described fossil allows us to test our regression equation. How accurate is it in predicting the size of the brain at birth in Neandertals (which we now know because of this new specimen)? Our regression would predict a brain size of about 425 cc, which is very close to the size of the brain at birth in the Mezmaiskaya infant and well within the 95% CI. When two independent methods arrive at the same result, it is reasonable to argue that the method is valid.

Referenecs

1. DeSilva J, and Lesnik J. 2008. Brain size at birth throughout human evolution: a new method for estimating neonatal brain size in hominins. Journal of Human Evolution, corrected proof in press.

2. Ponce de Leon M, Golovanova L, Doronichev V, Ramanova G, Akazawa T, Kondo O, Ishima H, and Zollikofer C. 2008. Neanderthal brain size at birth provides insights into the evolution of human life history. Proceedings of the National Academy of Sciences 105: 13764-13768