Did Homo naledi have big babies?

I’m working on a project analyzing infant remains of Homo naledi, a species of human that lived in South Africa around 300,000 years ago. In order to paint a full picture of infancy in this species, we need to estimate how big (or small) naledi newborns were. But without fossil neonates that could provide direct evidence of body size at birth, this is a tricky task.

Ideally, we could simply use adult body size estimates for Homo naledi to predict its body size at birth, using the scaling relationship in other primates as a guide. For example, using an average adult body size of 44 kg for Homo naledi (Garvin et al., 2017) yields an estimated newborn size of around 1.5 kg, based on published primate dataset (Barton and Cappellini, 2011). But this approach necessarily overlooks variation within each species, not to mention variation and uncertainty in Homo naledi adult size. In addition, the 95% prediction interval for this estimate ranges from under 1 kg (smaller than an average baboon baby) to almost as large as a human neonate.

Primate body size scaling (Barton & Cappellini, 2011). The black line is the regression for catarrhines (purple squares and blue circles), and the shaded grey area is the 95% prediction interval for newborns at a given adult catarrhine size.

And this gets at the other issue with the regression-based approach to estimating newborn body size in fossil hominins: humans are bad at being primates in some ways, as illustrated here by the fact that we don’t fit the newborn-adult body size relationship that characterizes other catarrhines (apes and monkeys of Africa and Eurasia).

Humans give birth to collosal kids. In contrast, gorillas are the largest living primates as adults, but their newborns are only a little over half the size of human neonates. Why do we have such giant babies? The most proximate reason is that humans are born with adult-ape-sized brains and quite a bit of baby fat as far as mammals go (Kuzawa, 1998). This tells us how babies are big, but it still begs the ultimate question of why—an enduring puzzle that you may have read about in the New York Times last week.

In order to land on a reasonable estimate of newborn body size in extinct humans, we need to figure out when evolution blew up the kid. Unfortunately, the only fossil hominin neonates are two Neandertals from France and Russia dating to under 100,000 years ago­­­—pretty remarkable, but they don’t necessarily tell us about earlier species like Homo naledi.

My colleague Jerry Desilva (2011) worked out a potential solution to this conundrum. He argued that one could work from adult brain size to newborn body size through the following steps. First, in contrast to newborn-adult body size scaling, humans are good catarrhines when it comes to newborn-adult brain size scaling. This means that we can reasonably estimate newborn brain size based on adult brain sizes, which are aplenty in the human fossil record. Second, humans and many other primate newborns have brains roughly 12% of their overall body mass, while the great ape newborns stand out with brains around 10% of their adult size. Putting these two pieces together, one could estimate newborn body size: Adult brain ➡️ newborn brain ➡️ 10–12% newborn body size

DeSilva showed that regardless of whether you use an ape or human model of newborn brain/body size, hominin babies from Australopithecus afarensis 3 million years ago onward were probably large relative to maternal body size, estimated independently using skeletal remains. It’s a bit of a tortuous approach to estimating body size at birth, but the assumptions are reasonable and it’s probably the best way to figure out this important life history variable given the fossil evidence. What does this mean for Homo naledi?

Virtual reconstruction of brain size and shape of the Homo naledi cranium “Neo” (work in progress). At 610 cm3, this is the largest and most complete Homo naledi endocast.

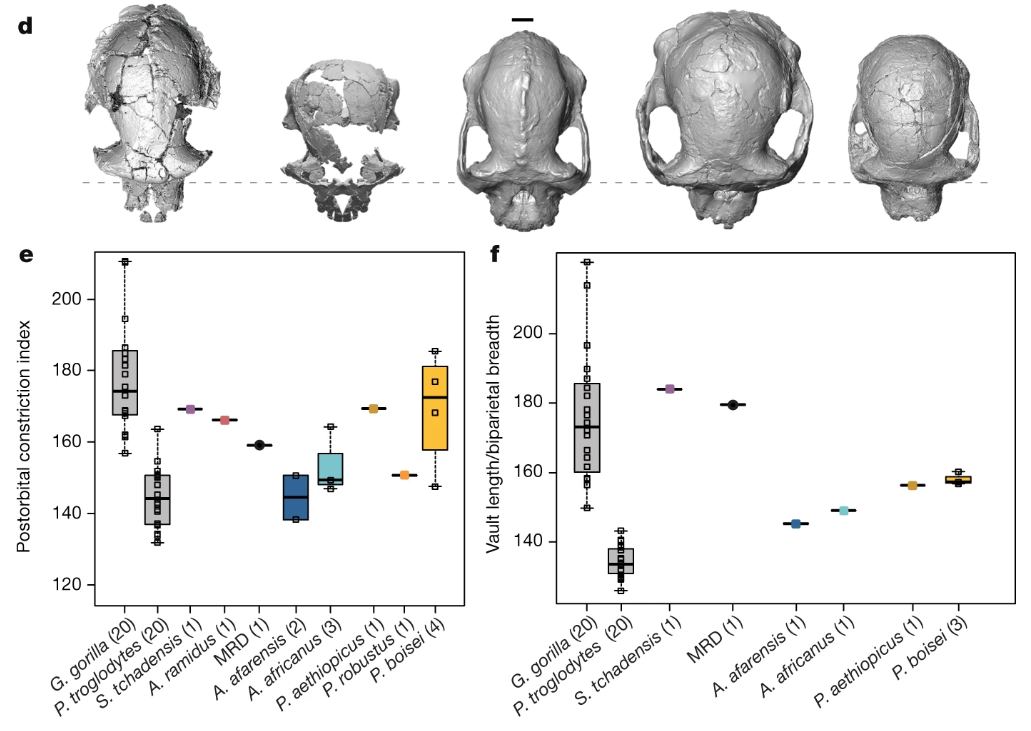
There are a few reliable adult brain size estimates for naledi, ranging from 465–610 cm3 (Berger et al., 2015; Garvin et al., 2017; Hawks et al., 2017), which based on catarrhine scaling would predict newborn brain size of around 170–210 cm3 (DeSilva and Lesnik, 2008). These brain sizes would then predict newborn body sizes of around 1.4–2.1 kg: the smol estimate is based on the smallest naledi adult brain size and a human model of newborn brain/body size; the chonk estimate is based on the largest naledi brain size and an ape brain/body model (pinkish stars in the boxplot below, left).

Boxplots of newborn body size in great apes. Gorilla, Chimpanzee, and Bonobo data from the Primate Aging Database (Kemnitz, 2019).

So, did Homo naledi have big babies? On the one hand, no: these 1.4–2.1 kg naledi newborns are outside the human range, and within the range of living great apes.

On the other hand, maybe Homo naledi babies were relatively large, though this depends on the size of Homo naledi adults. Recall from earlier that Garvin and colleagues arrived at an average estimated adult size of 44.2 kg. But this is an average of estimates for 20 separate naledi fossils, and each of these estimates has its own range of uncertainty. Garvin and team reported that the extremes of the prediction intervals for these estimates ranged from 28–62 kg. The second boxplot above shows newborn size relative to the adult average (sexes combined) for each species: for naledi, the six labels compare the smol and large newborn sizes (1.4 and 2.1 kg) with the adult average and extremes (28, 44, and 62 kg). Assuming the ‘true’ naledi sizes are somewhere in the middle of the range of estimates, naledi likely gave birth to babies 3–5% of adult body size, somewhat ‘intermediate’ between chimpanzees and humans (and bonobos…?) and similar to what DeSilva found for other hominins.

This is just a preliminary look at infancy in Homo naledi. There is a lot of uncertainty in these size estimates, but we should still be able to make some interesting inferences about growth and life history in our extinct evolutionary cousin.

REFERENCES

Barton, R. A., & Capellini, I. (2011). Maternal investment, life histories, and the costs of brain growth in mammals. Proceedings of the National Academy of Sciences, 108(15), 6169–6174. https://doi.org/10.1073/pnas.1019140108

Berger, L. R., Hawks, J., de Ruiter, D. J., Churchill, S. E., Schmid, P., Delezene, L. K., … Zipfel, B. (2015). Homo naledi, a new species of the genus Homo from the Dinaledi Chamber, South Africa. ELife, 4, e09560. https://doi.org/10.7554/eLife.09560

DeSilva, J. M. (2011). A shift toward birthing relatively large infants early in human evolution. Proceedings of the National Academy of Sciences, 108(3), 1022–1027. https://doi.org/10.1073/pnas.1003865108

DeSilva, J. M., & Lesnik, J. J. (2008). Brain size at birth throughout human evolution: A new method for estimating neonatal brain size in hominins. Journal of Human Evolution, 55(6), 1064–1074. https://doi.org/10.1016/j.jhevol.2008.07.008

Garvin, H. M., Elliott, M. C., Delezene, L. K., Hawks, J., Churchill, S. E., Berger, L. R., & Holliday, T. W. (2017). Body size, brain size, and sexual dimorphism in Homo naledi from the Dinaledi Chamber. Journal of Human Evolution, 111, 119–138. https://doi.org/10.1016/j.jhevol.2017.06.010

Hawks, J., Elliott, M., Schmid, P., Churchill, S. E., Ruiter, D. J. de, Roberts, E. M., … Berger, L. R. (2017). New fossil remains of Homo naledi from the Lesedi Chamber, South Africa. ELife, 6, e24232. https://doi.org/10.7554/eLife.24232

Kemnitz, J. W. (2019). Database for indices of aging in nonhuman primates. Innovation in Aging, 3(Suppl 1), S957. https://doi.org/10.1093/geroni/igz038.3472

Kuzawa, C. W. (1998). Adipose tissue in human infancy and childhood: An evolutionary perspective. American Journal of Physical Anthropology, 107(S27), 177–209. https://doi.org/10.1002/(SICI)1096-8644(1998)107:27+<177::AID-AJPA7>3.0.CO;2-B

Brain size & scaling – virtual lab activity

Each year in my intro bio-anthro class, we start the course by asking how our brains contribute to making us humans such quirky animals. Our first lab assignment in the class uses 3D models of brain endocasts, to ask whether modern human and fossil hominin brains are merely primate brains scaled up to a larger size. In the Before Times, students downloaded 3D meshes that I had made, and study and measure them with the open-source software Meshlab. But since the pandemic has forced everyone onto their own personal computers, I made the activity all online, to minimize issues arising from unequal access to computing resources. And since it’s all online, I may as well make it available to everyone in case it’s useful for other people’s teaching.

The lab involves taking measurements on 3D models on Sketchfab using their handy measurement tool, and entering the data into a Google Sheets table, which then automatically creates graphs, examines the scaling relationship between brain size (endocranial volume, ECV) and endocast measurements, and makes predictions about humans and fossil hominins based off the primate scaling relationship. Here’s the quick walk-through:

Go to the “Data sources” tab in the Google Sheet, follow the link to the Sketchfab Measurement Tool, and copy the link to the endocast you want to study (3D models can only be accessed with the specific links).

Following the endocast Sketchfab link (column D) will bring you to a page with the 3D endocast, as well as some information about how the endocast was created and includes its overall brain size (ECV in cubic cm). Pasting the link when prompted in the Measurement Tool page will allow you to load, view, and take linear measurements on the endocast.

Hylobates lar endocast, measuring cerebral hemisphere length between the green and red dots.

Sketchfab makes it quite easy to take simple linear measurements, by simply clicking where you want to place the start and end points. The 3D models of the endocasts are all properly scaled, and so all measurements that appear in the window are in millimeters.

The assignment specifies three simple measurements for students to take on each endocast (length, width, and height). In addition, students get to propose a measurement for the size of the prefrontal cortex, since our accompanying reading (Schoenemann, 2006) explains that it is debated whether the human prefrontal is disproportionately enlarged. All measurements are then entered into the Google Sheet — I wanted students to manually enter the ECV for each endocast, to help them appreciate the overall brain size differences in this virtual dataset (size and scale are often lost when you have to look at everything on the same-sized 2D screen).

Feel free to use or adapt this assignment for your own classes. The assignment instructions can be found here, and the data recording sheet (with links to endocast 3D models) can be found here — these are Google documents that are visible, but you can save and edit them by either downloading them or making a copy to open in Docs or Sheets.

Ah, teaching in the pandemic 🙃

Latest from the lab: Brain size at Krapina

In the latest paper out of the lab (here), my students and I reconstructed the brain endocasts of the Krapina Neandertals. The Krapina rock shelter in Croatia is a remarkable site. Dating to around 130,000 years ago (if not older), the Krapina fossils are early members of the Neandertal lineage. In addition, the fossils represent dozens of Neandertals, from infants to adults. Part of what drew me to the site were the juvenile skulls, since they can tell us about growth and development in these early humans. But, the fossils are quite fragmentary, and needed to be reconstructed to estimate important characteristics like brain size.

Figure 1 from our paper, showing the five Krapina crania (A & B are the same individual) with the endocranial surface highlighted.

Vassar College has a great program called URSI, where students team up with faculty to get hand on experience conducting research over the summer. So, two summers ago my students and I worked on virtually putting these Humpties Dumpty back together again. Using 3D surface scans of the original fossils and CT scans of modern humans, we used virtual methods to digitally reconstruct the endocasts, which are a good proxy for brain size and shape. Here’s the basic workflow:

Figure 2 from the paper, depicting the workflow for virtually reconstructing fossil endocasts, represented by the famous Krapina 3 or “C” cranium.

The human endocasts were produced from recent humans from the Terry Anatomical Collection, generously made available here by Dr. Lynn Copes. We have posted the 3D landmark data for the humans, the preserved landmarks from the Neandertals, and a big list of estimated brain sizes for Neandertals, in the open access repository Zenodo (here). So, hopefully anyone can repeat our results, or use these data in their own research.

With virtual methods, we could generate multiple reconstructions of each Neandertal fairly easily, giving an idea of how certain or uncertain our brain size estimates were. In the end, we showed that i) the Krapina juveniles, who were probably around 6-7 years old, had brain sizes within the adult range (it’s same with modern humans); ii) average brain size at Krapina was a little lower than previously estimated; and iii) although later Neandertals from other sites had larger brains on average, the difference is not necessarily greater than could be expected by chance.

I’ve participated in Vassar’s URSI program for the past few years and it has been a lot of fun. Last (virtual) summer, my students and I compared hip growth in humans and Australopithecus africanus, and this coming summer we will examine the brains of the greatest animals of all time — gibbons!

New decade, new syllabi

We just kicked off the Spring semester here at Vassar College, and so I’ve got some freshly-updated bio-anthro syllabi hot off the press. This semester, I’m doing my annual introductory class (Anth 120, “Human Origins”), a resurrected seminar (Anth 305: “Human Evo-Devo”), and a second stab at a new methods module (Anth 211: “Virtual Anthropology”).

Anth 120 is similar to previous versions, although this year I’ve taken out a reading/lecture on Paleolithic technology, replaced with articles scrutinizing evolutionary psychology. We’ll see how it goes.

The other two classes are greatly overhauled from previous versions. Anth 211, “Virtual Anthropology,” is my first contribution to a new curricular initiative here at Vassar, which are called “intensives.” Anth 211 is kind of a hybrid between a regular class and an independent study, giving students experience with computer-based, “virtual” methods used in biological anthropology and related fields.  In the first half of the semester, students will get to try out some of these methods and see what kinds of research questions they’re used for. In the 2nd half of the term, students do their own Virtual Anthropology study drawing on the materials in my HEAD Lab, and then present a research poster at the end of the year. I debuted this intensive last Fall, and based on that experience I’m providing a bit more training and have more activities for students this Spring. If last semester’s projects are at all predictive, we should have some fun projects in store this year.

cropped-screen-shot-2020-01-19-at-1.30.37-pm.png

Anth 305 is a fossil-focused examination of the roles of growth and development in human evolution, and this year’s version is also highly modified from the last time I taught it over two years ago. In that first version, course content was patterned along the skeleton, e.g., one week looked at evolution and development of teeth, next week the spine, etc. Such a bauplan might work for building bodies, but it wasn’t the best for teaching. So this year, we’re spending the first few weeks on the fossil record of human evolution, getting acquainted with the curious characters of our deep past. From there, we go over skeletal / developmental biology, before delving into special evo-devo topics like “morphological integration” and “heterochrony” for the rest of the semester. We’ll also read lots of old, “classic” papers along the way.

Syllabi for these, and other classes, can be found on the teaching page of the site, if you want to learn more.

New (old) Australopithecus anamensis cranium

The Fall semester here at Vassar kicks off next week, and so of course a new fossil discovery is published this week that threatens to upend my course plans and throw my syllabi into disarray. Haile-Selassie and colleagues report a very well-preserved hominin cranium, from the Woranso-Mille region of Ethiopia and dating to 3.8 million years ago. The new cranium shares features with Australopithecus anamensis, a species previously mainly known through jaws and teeth. The fossil is therefore really important since it puts a face to the species’ name, and it is the oldest relatively complete Australopithecus cranium known. When I showed a picture of the fossil to my wife, who is not a paleoanthropologist, all she said was that it looked like the face of a dog who got stung by a bee.

anamensis bee sting

The new A. anamensis fossil MRD-VP-1 (left), and a dog that lost a fight with a bee. Fossil photo from the Smithsonian‘s coverage.

The big buzz in many news stories about the fossil (for example, Nature, ScienceNews, etc.) is that it rewrites an evolutionary relationship early in human history, with Australopithecus anamensis no longer the ancestor of A. afarensis, but rather the two being contemporaries. That idea is based on a 3.9 million year old frontal bone attributed to A. afarensis from a site called Belohdelie, also in Ethiopia (Asfaw, 1987): basically, the new A. anamensis cranium reveals a hominin with a narrow frontal region of the brain, which lived 100,000 later than A. afarensis with a relatively expanded frontal region:

Screen Shot 2019-08-30 at 8.24.14 AM

Top views of the reconstructed A. anamensis cranium (left), and the Belohdelie frontal (center), and my crappy photoshopped overlay of Belohdelie on A. anamensis (right). Images not to scale.

The lede, “human evolutionary tree messier than thought,” is not terribly interesting or compelling since it seems to characterize most fossil discoveries over the past several years. And in this case I don’t know how well supported the argument is, since the trait in question (narrow frontal region of the braincase or “post-orbital constriction”) can vary dramatically within a single species. The image below is from the paper itself—compare the difference in “postorbital constriction index” (left graph) between the new A. anamensis cranium (MRD) and A. afarensis (in blue). Both sets of fossils fall within the range of chimpanzees (P. troglodytes), and note the great range of variation within gorillas (G. gorilla).

Screen Shot 2019-08-30 at 8.32.37 AM

Part of Figure 3 from the paper by Haile-Selassie and colleagues. On the top is a view from above of fossil humans: Sahelanthropus tchadensis, Ardipithecus ramidus, the new A. anamensis, A. afarensis, and A. africanus. Below the graphs show how species differ in narrowing of the frontal (left) and length of the skull (right).

What I find most interesting about the new find is the great front-to-back length of the cranium—check out how long and narrow the brain-case is of the fossil compared with the later hominins to the right. This is an interesting similarity with the much earlier (6 million years ago) Sahelanthropus tchadensis, which is the left-most fossil in the figure. It makes me really curious to see the brain endocast of A. anamensis and the Sahelanthropus cranium—what was brain shape like for these ancient animals, and what does that mean for the earliest stages of human brain evolution? The Sahelanthropus endocast was meticulously reconstructed and analyzed by Thibaut Bienvenu (dissertation here), who found it to be somewhat like gorillas in overall shape (but with a more hominin-like placement of the foramen magnum). Of course, the outside of the skull doesn’t necessarily tell us what the underlying brain shape was like. Haile-Selassie and colleagues report that they made a virtual reconstruction of the A. anamensis endocast, so hopefully we’ll get to pick its brain soon.


This is how we do it

It’s Friday night. Our description of the Homo naledi femora (thigh bones) from the Lesedi Chamber is hot off the press. This coincides with the publication of another study (with which I wasn’t involved) of the species’ proximal femur, so I guess you could say it’s a pretty hip time for Homo naledi fossils.

screenshot_116

An important task in our study was to estimate the diameter of the poorly preserved femur head (part of the hip joint), a variable which is useful for estimating body mass in extinct animals, which in turn is an important life history variable. One thing I’ve recently been griping about with my students is that while many general research methods are well published, the step-by-step processes usually are not. So, here I’ll detail exactly how we estimated femur head diameter (FHD) —it’s pretty simple, but it took a while to figure it out on my own. And now you won’t have to!

We used the simple yet brilliant approach that Ashley Hammond and colleagues (2013) developed for the acetabulum (the hip socket). In brief, if you have a 3D model or mesh of a bone, you can use various software packages to highlight an area and the software will find the best fit of a given shape to that surface. I used Amira/Avizo and Geomagic Design X, which are great but admittedly quite expensive.

1. Identify the preserved bony surface by making a curvature map
You can do this in Geomagic, but I figured it out in Amira first, so here we are. Also,  Amira gives you more control over the resulting colormap, which I think makes it easier to identify preserved vs. broken bone surfaces. The module-based workflow of Amira/Avizo takes some getting used to, but this step is quite simple, once you’ve imported the mesh (“UW 102a-001.stl” in the image below).

step 1

Amira workflow (left). The red “Curvature” module is applied to the surface mesh (“UW102a-001.stl”), resulting in a new object (“MaxCurvatureInv”), whose surface view is depicted at right.

The surface is now color-coded, with areas of high curvature (i.e., broken bone and exposed trabecular bone) in blue and better-preserved surfaces in red. This allows you to see which portion(s) of the bone to use to define the sphere.

Screen Shot 2019-06-26 at 10.55.28 AM

The curvature map reveals three large patches (A-C) of decently-preserved hip joint surface.

2. Highlight the desired surface in Geomagic
Import the 3D mesh into Geomagic, and use the “Lasso selection mode” to highlight the area (or areas) you wish to fit a sphere to. Make sure that you’ve toggled “Visible only,” so that you don’t accidentally highlight other parts of the bone. You can select a single area, or many areas. In the following example, I’ve highlighted only the large patch (“A” in the previous figure).

Screen Shot 2019-06-26 at 11.25.59 AM

3. Go all Brexit on the highlighted region
That is, declare it as its own distinct region. Navigate to the “Region” tab and click the “Insert” icon. Magically, the highlighted region is now outlined and a shaded in a new color, and listed as “Region group 1” in the window on the left.

Picture1

4. Measure the region’s radius
Select the “Measure Radius” icon at the bottom of the window, and then when you scroll or hover the mouse over the region, the radius will appear within the patch. The value should be the same throughout the region which is now treated as a spherical surface.

Screen Shot 2019-06-26 at 12.19.36 PM

5. Visualize the fitted sphere
If your main goal is to obtain estimates of diameters, you can stop here (don’t forget that the diameter is radius x 2!). But it can be handy to know how the proximal femur would look with the complete head (not that these are perfectly spherical…). To do this, navigate to the “Model” tab and select the “Surface primitive” icon. In the grey menus that appear on the left, select the region and “Sphere” as the shape to be extracted.

Picture1

Three orthogonal circumferences will appear around the highlighted area, and if they look OK, click the right-pointing arrow at the top of the menus, and there you go!

Picture1

Wowzers.

I did this a few times on the Homo naledi femur from Lesedi, and got measurements within about 1-2 mm of one another, which is good. What’s more, we used this method on a sample of modern human and fossil hominin femur heads for which the actual diameters were known, to demonstrate the accuracy of the method.

Lesedi sphere vs FHD_No Krapina copy

Femur head diameter measured directly (y-axis) vs. sphere-based estimates using the method described here (x-axis). The Homo naledi estimate is indicated by the blue line.

This graph shows that the sphere-based estimates very closely approximate direct measurements, although there is some slight overestimation at larger sizes, i.e. not affecting the H. naledi value. So although the fossil is not perfectly preserved, we are fairly confident in our estimate of its femur head diameter.

The most complete Australopithecus skeleton

StW 573, a hominin skeleton more palatably nicknamed “Little Foot,” made its big debut last week:

800 (3)

Ron Clarke showcases the lovingly-excavated skeleton (Photo credit: AP/Themba Hadebe)

The skeleton is remarkable in that it is the most complete australopithecine individual ever discovered, and is among the most complete in the entire hominin fossil record. Below I’ve compared it to the most complete Australopithecus afarensis (KSD-VP-1/1 and AL 288-1), A. africanus (StW 431 and Sts 14), and A. sediba (MH1-2); the Dikika infant would be a neat comparison, too, but I don’t know of any photos of its bones nicely laid out. The other skeletons are practically naked (or dismembered) compared to Little Foot.

Australopithecus skeletons.png

Little Foot (red) compared with other australopithecine skeletons. Images not to scale! (Photo credit: The Internet!)

Beyond it’s completeness, the other parts of story of Little Foot are equally fascinating – from its discovery based on already-known fragments to the possibility that it is older than “Lucy” (AL-288). Ron Clarke has painstakingly and I’d say very successfully removed the skeleton from the hard breccia in which the fossils were encased. Having spent the better part of the past two decades with the skeleton, he has argued that Little Foot represents a second hominin species at Sterkfontein, Australopithecus prometheus (Clarke 2013), the species to which hominin fossils at Makapansgat were originally attributed (Dart 1948). With the unveiling of the skeleton, I’d guess that in the coming years we’ll see renewed investigations into the number of species at Sterkfontein, and the general comparison between hominins from there and Makapansgat.

From pictures in the media releases, we can see a few things that weren’t known from previous publications. I’ll outline a few here, but emphasize that these are only  superficial observations and will need to be borne out by further research.

800 (5)

“EXPELLIARMUS”

At the top of the trunk, the cervical vertebra seems to have a fairly wide spinal canal, a human-like ‘bulging’ which Meyer and Hausler (2015) suggest might reflect innervation of highly manipulative hominin hands.

Stw 573 thorax

Close up of the skull and upper trunk of StW 573, highlighting the cervical vertebral canal (white arrow) and first rib (orange arrow). Original photo credit: AP//Themba Hadebe.

In addition, the first rib may be relatively long front-to-back (as opposed to wide side-to-side), possibly indicating a more barrel-like chest than in other early hominins; the angle of the photo and the clear break between the proximal and distal portions, however, makes this unclear.

Screen Shot 2017-12-11 at 9.21.13 AM

Hominin first ribs/bacon, with StW 573 on the far right. Not to scale! Modified from this post.

The distal forelimb (i.e., radius and ulna) are not as elongated as in apes, but the femur is not as elongated as in the genus Homo. From the pictures, the femur neck appears short like in humans, not as elongated as is characteristic for australopiths and early Homo.

Limb comparison Stw 573

Limb proportion comparison. Humerus (top row), radius & ulna (middle), and femur (bottom). Image modified from Asfaw et al. (1999). StW 573 scaled to same humerus length as the human. Note also that all bones are from the right except the StW 573 upper limb.

The apparently short femur neck, similar to humans, contrasts with the wide, flaring ilium of the pelvis. This appears fairly flat, short and wide (Australopithecus af) compared to modern humans’ more strongly curved ilium. But this inference is just from a picture and it’s likely that the fossil needs a bit of reconstruction to uncover the true anatomy.

Screen Shot 2017-12-08 at 3.28.27 PM

StW 573 pelvis (left) compared with Sts 14 (A. africanus, middle) and SH pelvis 1 (archaic Homo, right). Sts 14 modified from Berge & Goularis (2010) and SH pelvis 1 from Bonmati et al. (2010).

I’d like to emphasize that these are just first impressions based on press release photos, and actual analysis of the skeleton are necessary to tell if these impressions are correct. As could be expected, the skeleton as a whole looks typically australopithecine, although the short femur neck may be a bit different. As 2017 draws to a close, let’s hope 2018 sees the testing of these predictions.

References

Asfaw B. et al. 1999. Australopithecus garhi: a new species of early hominid from Ethiopia. Science 284: 629-635.

Berge C and Goularis D. 2010. A new reconstruction of Sts 14 pelvis (Australopithecus africanus) from computed tomography and three-dimensional modeling techniques. Journal of Human Evolution 58: 262-272.

Bonmati A. et al. 2010.Middle Pleistocene lower back and pelvis from an aged human individual from the Sima de los Huesos site, Spain. Proceedings of the National Academy of Sciences 107: 18386-18391.

Clarke RJ. 2013. Australopithecus from Sterkfontein Caves, South Africa. In The Paleobiology of Australopithecus, Reed et al., eds. Dordrecht: Springer Science+Business.

Dart R. 1948. The Makapansgat proto-human Australopithecus prometheusAmerican Journal of Physical Anthropology 6: 259-284.

Meyer M. and Hausler M. 2015. Spinal cord evolution in early Homo. Journal of Human Evolution 88: 43-53.

New anthropology syllabi for 2017

This Fall I’m teaching three courses at Vassar, two in Anthropology and one in Environmental Studies. Syllabi are posted to my Teaching page in case anyone wants to use them – here are the highlights:

Anth 235: Central Asian Prehistory

Anth 235 site map

I taught this for the first time last Spring, so the Fall syllabus is updated based on how things went in the first go around. This time, students will get more more in depth with the fossil hominins and less on the lithics on the early side. On the more recent end, there are now readings expressly concerned with sites of the Bactrian-Margiana Archaeological Complex, as well as archaeology of both the Tarim and Pazyryk mummies.

Anth 305: Human Evolutionary Developmental Biology

cropped-zevodevo1.jpg

This is a seminar version of the first class I ever made on my own, previously taught at the University of Michigan and Nazarbayev University. There have been lots of new discoveries and I’ve published more on this topic since the last time I taught the class. I’m  also excited to see how this class goes as a seminar in which students contribute more to discussion, rather than me rambling on about osteoblasts, morphological integration, and the like.

Enst 187: A Prehistoric Perspective on Climate Change

climatesummit

This is a 100% brand spankin new class, that uses the climate-denialist argument, “But climate has always been changing,” as a basis for comparing the past and the present. In this First-year Writing Seminar, we’ll compare arguments for defining the “Anthropocene,” examine how climate change may have impacted human evolution, and study archaeological evidence for how climate change has impacted different prehistoric societies.

Osteology Everywhere: Aerial Ossicles

Last month I was flying down to New Orleans for the AAPA conference. I was excited to try authentic beignets & sazeracs, present new research, and catch up with colleagues. Midway through the flight I glanced out the window, not expecting to see much. But lo!

twilight

Thankfully there wasn’t something on the wing. But there was something strange out there in the sparkle of sprawling city lights:

IMG_20170419_084210_479

What’s that I spy outside the city center?

A bit outside of the main jumble of street lamps appears to be a concentration of light superficially similar to an incus, one of the three auditory ossicles of the middle ear:

nightmare

Left: An osteologist’s nightmare at 20,000 feet. Right: Ear ossicles from White et al. (2012).

As a good mammal, there are three small bones inside your middle ear. These are fully formed at birth, and help transfer and amplify sound vibrations from your eardrum to your inner ear. It’s nuts. What’s even more nuts is that paleontologists and anatomists have figured out that the tiny, internal incus and malleus of mammals evolved from larger, external pieces of the jaws of our pre-mammalian ancestors. INSANITY!

anatomy-of-the-inner-ear-chart2b1

Cross section of a right ear, viewed from the front. Image credit.

Being so tiny, it’s not surprising that auditory ossicles are not often recovered from skeletal remains, and are pretty rare in the human fossil record. Nevertheless, some are known and their comparison with humans’ ossicles is pretty interesting. The oldest incudes (yes, the plural of incus is incudes) I know of are from SK 848 and SKW 18Australopithecus robustus fossils from Swartkrans in South Africa (Rak and Clarke, 1979; Quam et al., 2013). SK 848 is on the left in the set of images below:

Ossicles

Incus bones in three different views of SK 848, human chimpanzee, gorilla, sock puppet (left to right). Modified from Rak and Clarke, 1979.

SK 848 to differs from humans and African apes in looking more like a screaming sock puppet with a horn on the back of its head. Additional ossicles are known from South African australopithecines, including the older A. africanus from Sterkfontein (Quam et al., 2013). Interestingly, malleus of these hominins is very similar to that of humans, and Quam et al. (2013) think this ossicle may be one of the first bones in the entire skeleton to take on a human-like configuration during hominin evolution. Functionally, this may mean that the frequency range to which human ears are adapted may have appeared pretty early in our lineage as well (Quam et al., 2015).

Who’d’ve thunk we’d learn so much just from looking out an airplane window?

anthropology
ResearchBlogging.orgRead more!

Quam, R., de Ruiter, D., Masali, M., Arsuaga, J., Martinez, I., & Moggi-Cecchi, J. (2013). Early hominin auditory ossicles from South Africa Proceedings of the National Academy of Sciences, 110 (22), 8847-8851 DOI: 10.1073/pnas.1303375110

Quam, R., Martinez, I., Rosa, M., Bonmati, A., Lorenzo, C., de Ruiter, D., Moggi-Cecchi, J., Conde Valverde, M., Jarabo, P., Menter, C., Thackeray, J., & Arsuaga, J. (2015). Early hominin auditory capacities Science Advances, 1 (8) DOI: 10.1126/sciadv.1500355

Rak Y, & Clarke RJ (1979). Ear ossicle of australopithecus robustus. Nature, 279 (5708), 62-3 PMID: 377094

#AAPA2017 – Modularity & evolution of the human canine

I’m recently returned from this year’s AAPA Conference, hosted by Tulane University in New Orleans. What a trip!

Usually my presentations involve fossils and/or growth, but this year I wanted to try a different way of looking at the evolution & development – integration & modularity. In short, biological structures that share a common developmental background and/or function may comprise ‘modules’ that are highly ‘integrated’ with one another, but relatively less integrated with other structures or modules.

I hypothesized that canine reduction in hominins is a result of a shift in modularity of the dentition, such that the canine became more highly integrated with the incisors than with the premolars. I’d thought of this 5 years ago when creating the first rendition of my human evo-devo course (offering again next fall!), but never got to look into it. Interestingly, the results generally supported my predictions, except for one pesky sample…

Screen Shot 2017-04-23 at 8.36.05 AM

As my primatologist friends will tell you, male chimps are the worst.

Here’s a pdf version of the poster. It was fun to dabble with a new methodology, to see my far-flung friends, and to visit a fun historic place for the AAPA conference. Definitely looking forward to next year in Austin!