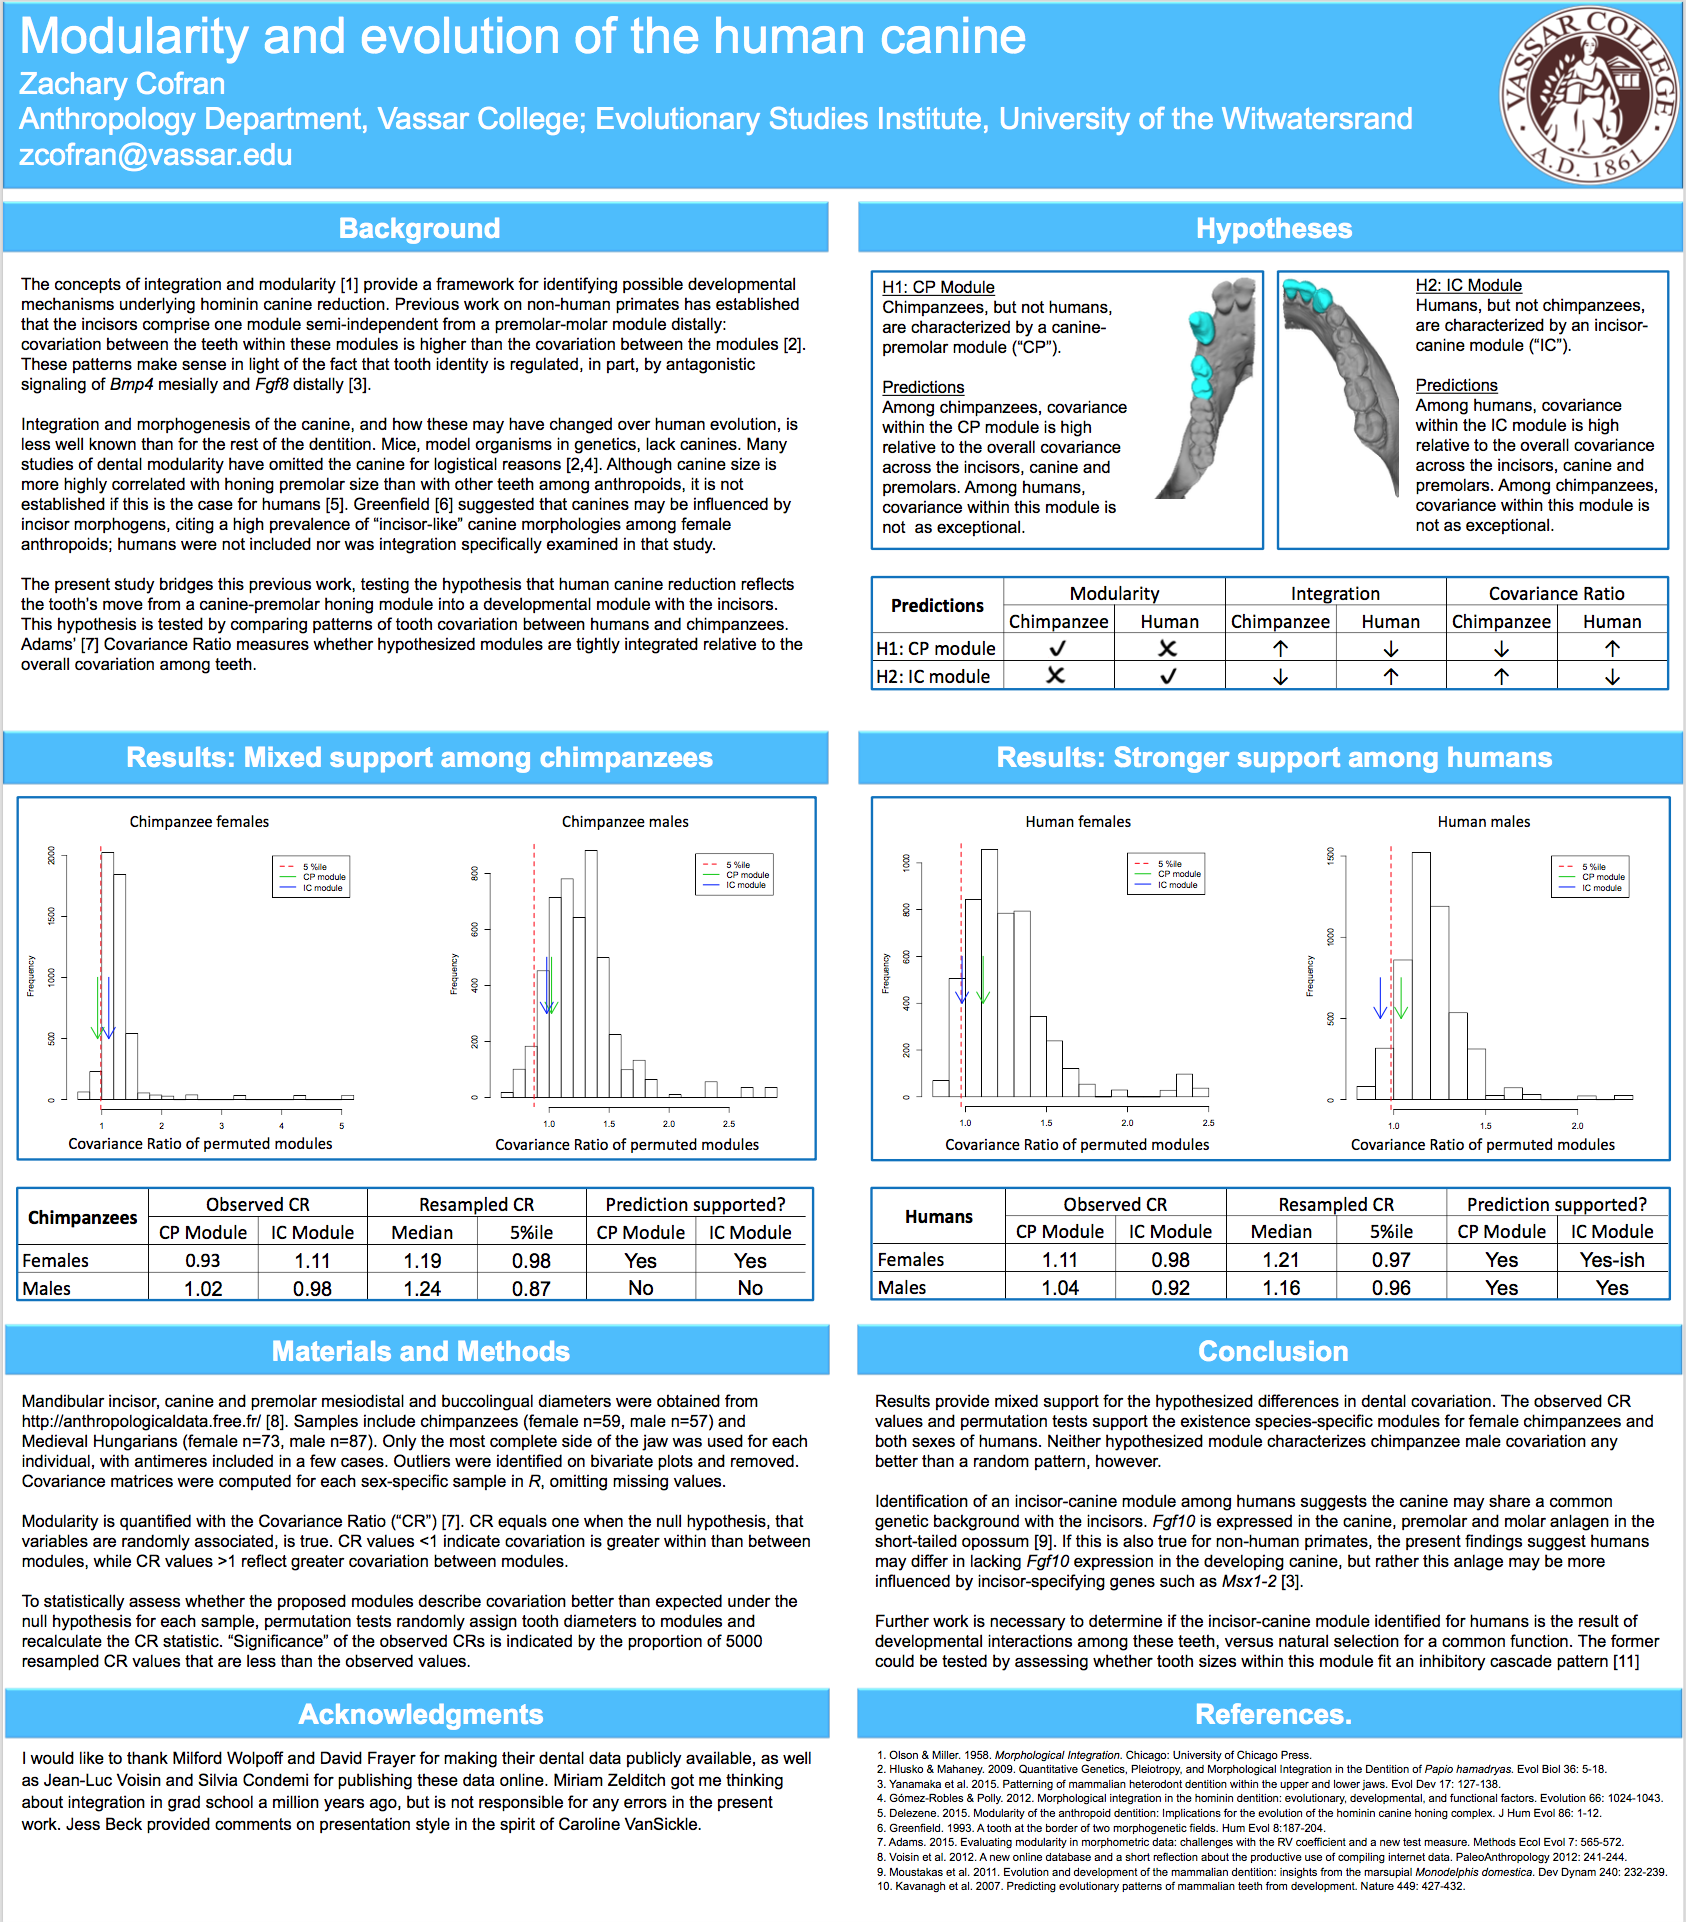
The bony labyrinth combines two of my favorite things: skull cavities that tell us about living and extinct animals, and Jim Henson dark fantasy films. This ludicrous structure is nestled within each of the two temporal bones of the skull, filled with fluid surrounding the organs of balance and hearing.

As former senator Ted Stevens once famously described the internet, the labyrinth is kind of like a series of tubes: namely the cochlear duct and three semicircular ducts, each housed within its own bony canal. These ducts (and canals) meet one another in the bony vestibule, where they’re interconnected with two “otolithic” organs called the utricle and saccule. Movement of fluid within these ducts (and otolithic structures) gets translated into signals that are then sent to the brain. The vestibular system including semicircular ducts and otolithic organs helps you detect your head and body’s movement through space (or as the world falls down), while the cochlear system translates waves of pressure hitting the ear into sound.
As noted by Christopher Smith (the scientist who studies the labyrinth, not the filmmaker who has directed the TV show Labyrinth), this elegant sensory system is present in all vertebrates, inherited from our common ancestor that lived over 500 million years ago. The structure is so important to individual survival that it seems to be fully formed before birth [1], surrounded by the densest bone in the body [2]. This snail in your ear therefore has a lot to say about life on Earth.
The labyrinth has been studied to trace the evolutionary origins of endothermy (warm-bloodedness) in mammals [3]. Because the size of semicircular ducts/canals correlates with sensitivity to head movements, it has been used to reconstruct how extinct primates moved around[4], including the earliest human ancestors to walk on two feet [5]. Because cochlea length and coiling correlates with hearing capacities [6], scientists can use the labyrinth to reconstruct what kinds of sounds extinct organisms could have heard [7]. Some studies have found the labyrinth to be sexually dimorphic in humans [8,9] (though this varies across different populations [10,11]), meaning that it could be used to estimate sex from archaeological or fossil remains, including of non-adults.
As David Bowie sang in the movie Labyrinth, “Down in the underground you’ll find someone true.” He could well have been singing about the bony labyrinth, a gift to paleontologists: a small, strange time capsule brimming with biological information.
References
1. Jeffery, N., & Spoor, F. (2004). Prenatal growth and development of the modern human labyrinth. Journal of Anatomy, 204(2), 71–92. https://doi.org/10.1111/j.1469-7580.2004.00250.x
2. Pinhasi, R., Fernandes, D., Sirak, K., Novak, M., Connell, S., Alpaslan-Roodenberg, S., Gerritsen, F., Moiseyev, V., Gromov, A., Raczky, P., Anders, A., Pietrusewsky, M., Rollefson, G., Jovanovic, M., Trinhhoang, H., Bar-Oz, G., Oxenham, M., Matsumura, H., & Hofreiter, M. (2015). Optimal ancient dna yields from the inner ear part of the human petrous bone. PLOS ONE, 10(6), e0129102. https://doi.org/10.1371/journal.pone.0129102
3. Araújo, R., David, R., Benoit, J., Lungmus, J. K., Stoessel, A., Barrett, P. M., Maisano, J. A., Ekdale, E., Orliac, M., Luo, Z.-X., Martinelli, A. G., Hoffman, E. A., Sidor, C. A., Martins, R. M. S., Spoor, F., & Angielczyk, K. D. (2022). Inner ear biomechanics reveals a Late Triassic origin for mammalian endothermy. Nature, 607(7920), 726–731. https://doi.org/10.1038/s41586-022-04963-z
4. Ryan, T. M., Silcox, M. T., Walker, A., Mao, X., Begun, D. R., Benefit, B. R., Gingerich, P. D., Köhler, M., Kordos, L., McCrossin, M. L., Moyà-Solà, S., Sanders, W. J., Seiffert, E. R., Simons, E., Zalmout, I. S., & Spoor, F. (2012). Evolution of locomotion in Anthropoidea: The semicircular canal evidence. Proceedings of the Royal Society B: Biological Sciences, 279(1742), 3467–3475. https://doi.org/10.1098/rspb.2012.0939
5. Spoor, F., Wood, B., & Zonneveld, F. (1994). Implications of early hominid labyrinthine morphology for evolution of human bipedal locomotion. Nature, 369(6482), 645–648. https://doi.org/10.1038/369645a0
6. Manoussaki, D., Chadwick, R. S., Ketten, D. R., Arruda, J., Dimitriadis, E. K., & O’Malley, J. T. (2008). The influence of cochlear shape on low-frequency hearing. Proceedings of the National Academy of Sciences, 105(16), 6162–6166. https://doi.org/10.1073/pnas.0710037105
7. Coleman, M. N., & Boyer, D. M. (2012). Inner ear evolution in primates through the cenozoic: Implications for the evolution of hearing. The Anatomical Record, 295(4), 615–631. https://doi.org/10.1002/ar.22422
8. Osipov, B., Harvati, K., Nathena, D., Spanakis, K., Karantanas, A., & Kranioti, E. F. (2013). Sexual dimorphism of the bony labyrinth: A new age‐independent method. American Journal of Physical Anthropology, 151(2), 290–301. https://doi.org/10.1002/ajpa.22279
9. Braga, J., Samir, C., Risser, L., Dumoncel, J., Descouens, D., Thackeray, J. F., Balaresque, P., Oettlé, A., Loubes, J.-M., & Fradi, A. (2019). Cochlear shape reveals that the human organ of hearing is sex-typed from birth. Scientific Reports, 9(1), 10889. https://doi.org/10.1038/s41598-019-47433-9
10. Uhl, A., Karakostis, F. A., Wahl, J., & Harvati, K. (2020). A cross-population study of sexual dimorphism in the bony labyrinth. Archaeological and Anthropological Sciences, 12(7), 132. https://doi.org/10.1007/s12520-020-01046-w
11. Ward, D. L., Pomeroy, E., Schroeder, L., Viola, T. B., Silcox, M. T., & Stock, J. T. (2020). Can bony labyrinth dimensions predict biological sex in archaeological samples? Journal of Archaeological Science: Reports, 31, 102354. https://doi.org/10.1016/j.jasrep.2020.102354