As was predicted long ago, and is becoming increasingly apparent, many anatomical differences between individuals are due not so much to the DNA coding for specific proteins (“genes”), but rather to the DNA that helps regulate when, where and how much these genes are expressed. A recent paper by Catia Attanasio and colleagues have identified thousands of these latter regions that appear to influence the development of facial shape, using a mélange of modern molecular, microscopic & morphometric methods. This is an exciting step toward understanding the genetic bases of facial variation within, and probably between, species.
Attanasio and colleagues identified “enhancers,” bits of DNA that enhance or increase the transcription of certain genes, relating to the embryonic development of the face. One interesting thing about these enhancers is that they aren’t usually found within the genes they enhance, but may be as far away as a few hundred thousand nucleotides. This is part of why these regulatory elements can be so hard to ascertain. What’s more, in the researchers’ own words, enhancers “often control the expression of their target genes in a modular fashion, where different enhancers activate the expression of the same gene in different cell types, anatomical regions, or at different developmental time points.” So in addition to the difficulty in finding enhancers, their varied ‘behavior’ makes it difficult to figure out exactly what each one does.
I won’t get into the methods they used to do this, but basically they were able to visualize when and where many of these enhancers were active in the developing face of mouse embryos. They also showed that tinkering with these enhancers had characteristic effects on bony facial shape in adults. The results are amazing:
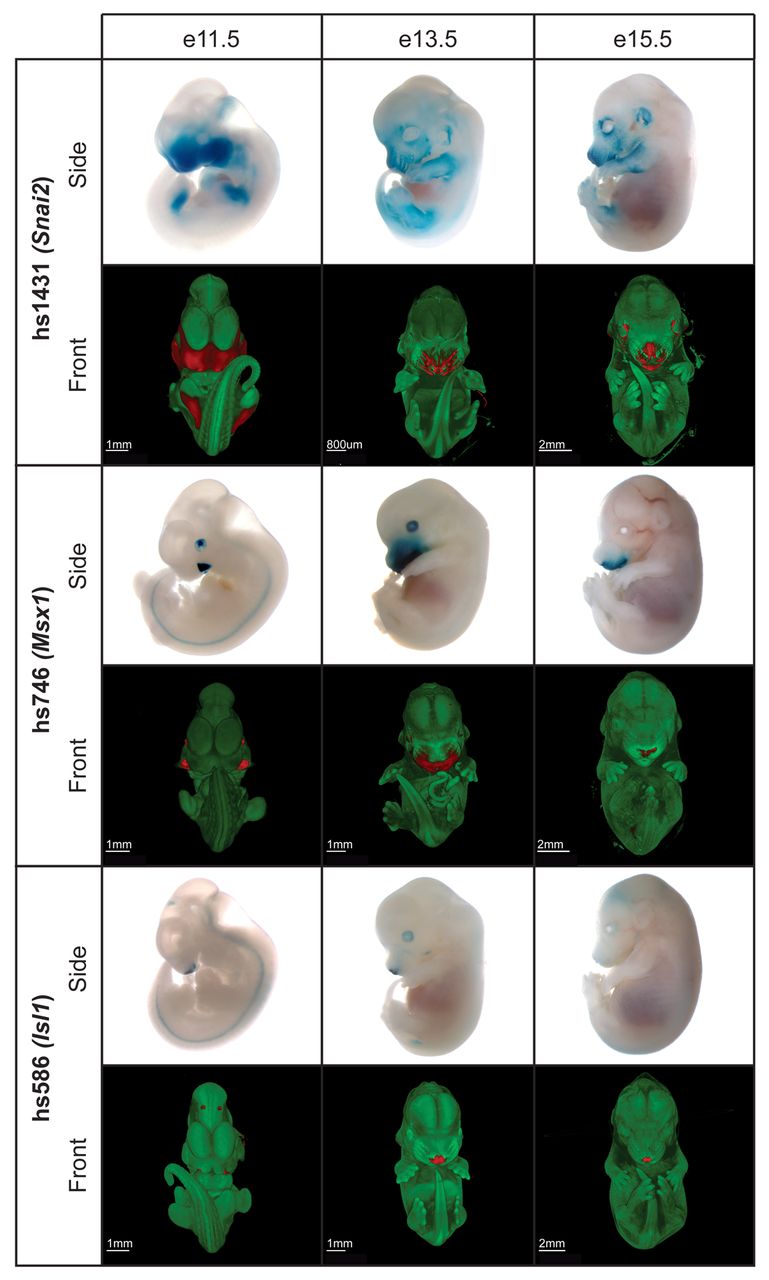
Figure 5 from the paper. Blue/red indicate presence of a given enhancer. The white/blue images are actual mouse embryos, from younger (left) to older (right). Each green/red image is a 3D reconstruction of the blue/white embryo above, based on optical projection tomography.
Science has also made a very informative and visually stunning video to accompany the paper. Check it out. NOW.
So. Facial shape is the result of massively complex interactions between not just numerous genes, but also the coordination of thousands enhancers and other types of non-coding DNA regulating gene expression. Many other studies have tried to uncover the genetic bases of complex phenotypes (usually diseases) via genome wide association studies (GWAS), scanning genomes for shared genetic variants between individuals with similar phenotypes (I discussed this approach briefly Friday). In contrast to GWAS, what I really like about this study by Attanasio and colleagues is that they not only identify specific stretches of DNA as enhancers, but they also mapped their activity in developing embryos. Thus they could actually see how genetic variants contribute to phenotypes.
This is an important step toward understanding exactly how various genetic diseases affecting the face manifest. In addition, this and other studies uncovering the complex molecular interactions influencing facial shape could form the bases for computational models of development, to predict the genetic and developmental origins of facial evolution.
The paper: Attanasio C et al. 2013. Fine tuning of craniofacial morphology by distant-acting enhancers. Science 342: 1241006.