#AAPA2017 – Modularity & evolution of the human canine

I’m recently returned from this year’s AAPA Conference, hosted by Tulane University in New Orleans. What a trip!

Usually my presentations involve fossils and/or growth, but this year I wanted to try a different way of looking at the evolution & development – integration & modularity. In short, biological structures that share a common developmental background and/or function may comprise ‘modules’ that are highly ‘integrated’ with one another, but relatively less integrated with other structures or modules.

I hypothesized that canine reduction in hominins is a result of a shift in modularity of the dentition, such that the canine became more highly integrated with the incisors than with the premolars. I’d thought of this 5 years ago when creating the first rendition of my human evo-devo course (offering again next fall!), but never got to look into it. Interestingly, the results generally supported my predictions, except for one pesky sample…

Screen Shot 2017-04-23 at 8.36.05 AM

As my primatologist friends will tell you, male chimps are the worst.

Here’s a pdf version of the poster. It was fun to dabble with a new methodology, to see my far-flung friends, and to visit a fun historic place for the AAPA conference. Definitely looking forward to next year in Austin!

Can ‘ape-like’ actually be ‘human-like’?

I’m reading up on life history in Homo erectus for a few projects I’m working on, and something’s just caught my eye. A 2012 issue of Current Anthropology presents a series of papers from the 2011 symposium, “Human Biology and the Origins of Homo.” This issue is full of great stuff, and to top it all off, it can be accessed online for free! (here’s the JSTOR link)

Gary Schwartz has a paper here recounting what is known (or as he stresses, what is still largely unknown) about growth and life history in early Homo. Dental evidence accumulated over the past 30 years has pointed to a rapid (ape-like) life cycle for fossil hominins, in comparison with a slow, long and drawn out human pattern. But much of the evidence against a human-like pattern is somewhat indirect. For instance, Holly Smith (1991) has shown that there’s a pretty tight relationship between brain size and age at first molar (M1) eruption in Primates:

M1 crancap

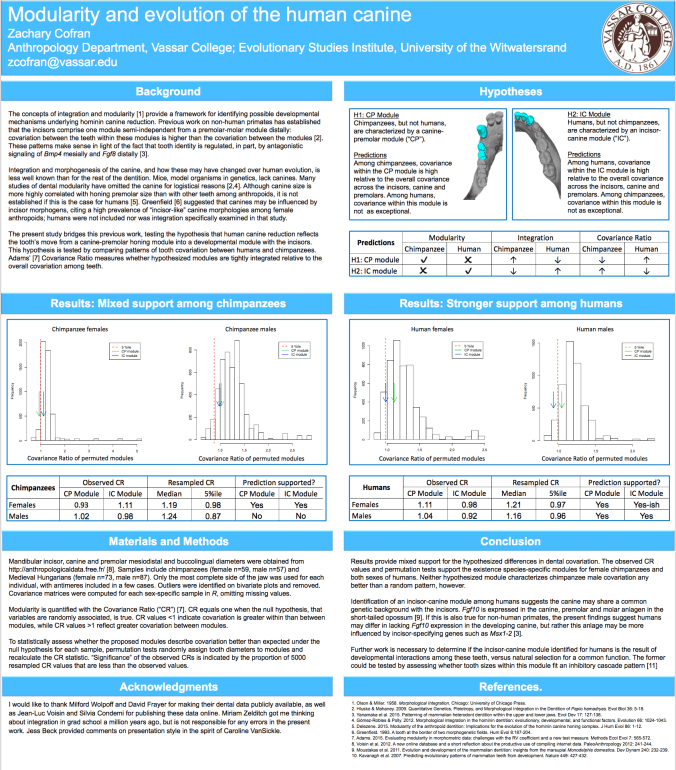
Fig. 1 from Schwartz (2012). “Bivariate plot of ln M1 emergence age in months (y) versus ln cranial capacity in cubic centimeters (x) for a sample of anthropoids.” The hominins and humans are the open shapes, to which I’ve visually fitted the red line.

It’s a very high correlation (r=0.98). This means that armed with simply an animal’s cranial capacity, which is fairly easy to estimate given complete enough fossils, one can estimate with a bit of confidence its likely age range for M1 emergence. With brain sizes between apes’ and ours, fossil hominins can be estimated to have erupted their M1s at younger ages than us. Many subsequent studies of tooth formation, based on the microscopic remnants of tooth development, have supported these inferences. So presumably, faster, ape-like dental development could be extrapolated to mean ape-like body growth rates and other aspects of life history as well.

But although this is a tight relationship, there are deviations. As Schwartz notes in the article, and others have noted before, high correlations found when examining large interspecific groups (e.g., primates as a whole) often break down when the focus is on smaller groups of more closely related species (e.g., just apes). Based on the relationship figured above, humans are expected to erupt M1 around 7 years of age, but nearly all humans erupt M1 closer to 6 years (hence the open diamond for humans is below the regression line). What hominins appear to share in common with humans is a younger age at M1 eruption than expected for primates of their brain sizes (the red line I’ve added to the figure).

Hominins’ faster dental development and eruption may be ape-like in absolute terms, but eruption ages may be human-like when their brain size is taken to account. As with many life history variables, the significance of this similarity (if anything) is difficult to ascertain.

Friday excitement: Panoramic data inspection

I teach Tuesdays and Thursdays this year, leaving Fridays welcomely wide open for non-teaching related productivity. Today’s task is arguably the most exhilarating aspect of doing Science – inspecting raw data to make sure there are no major errors or problems in the dataset, so I can then analyze it and change the world. The excitement is truly hard to contain.

Delectable dog food is the dataset; I’m the dog.

No, it’s not the funnest, but it’s an important part of doing Science. To make your life easier, you should inspect data daily as you collect them. This way, you can identify mistakes and make notes about outliers early on, so that you are not stupefied and stalemated by what you see when you sit down to begin analysis.

You (corgi) are getting ready to analyze and you find an anomalous observation (door stop) you didn’t notice when you were collecting data.

Today I’m looking at measurements I took from ape mandibles housed in an English museum last summer; I inspected data before I left the UK for KZ, so today should be a breeze. But no matter how meticulous you are in the field/museum, you still need to inspect your data before analyzing them, just to be safe. If you’re as disorganized as I am, there will be lots of programs each with lots of windows. Here’s a tip: plug into multiple monitors (or at least one big ass monitor), so you can easily espy all open windows and programs in prodigious panorama.

Using two monitors helps when checking data for errors and patterns

Using two monitors helps when checking data for errors and patterns. On my left screen I’m using R to visualize and examine the raw data open in Excel on the right screen. If something seems off on the left screen, I can quickly consult the original spreadsheet on the right.

Barely visible in the above screenshot, these are chimpanzee (red) and gorilla (black) mandible measurements plotted against a measure of body size, preliminarily described in this post from last August. I’m looking at whether any mandibular measurements track body size across the subadult growth period, in hopes that bodily growth can be studied in fossil species samples dominated by kid jaws. As you can (barely) see, some jaw measurements correlate with body size better than others, and sometimes the apes follow similar patterns but other times they don’t.

The data look good, so now I can go on to examine relationships between mandible and body size in more detail. Stay tuned for results!

Mandible as a measure of overall body size?

I’m currently in Kent, United Kingdom, examining African ape jaws to follow up on my dissertation research comparing jaw growth in humans and Australopithecus robustus (having a tough time writing this stuff up for journal publication, but hopefully things’ll start coming out soon). One thing I’d assumed (with evidence, of course), was that aspects of mandibular size could serve as a proxy for body size, to make inferences about body growth. Now that I’m in Kent, I’m hoping to get good evidence of this in the non-human African apes.

The Powell Cotton Museum in Kent has an awesome collection of chimpanzees and gorillas (see the Human Origins Database by Adam Gordon and Bernard Wood for more information on these samples). This collection was accumulated during a time last century when explorers would go out and collect specimens from the wild, usually by finding and killing them. Now, when Major Percy Powell-Cotton was out doing this, he or some of his assistants actually collected measurements on some of the corpses – arm span, height, head+body length, and chest girth. This means we can see which aspects of the mandible correlate with body size, which is important since the fossil record usually affords us mandibles more than any other part of the skeleton.

Length of the back of the ramus to the P4, plotted against measures of body size.

Length of the back of the ramus to the P4, plotted against measures of body size. Colors/shapes represent 1 of 5 dental eruption age groups.

There aren’t body size measurements for all individuals, and I’ve been biasing my own sampling toward subadults. So I only have body size data for up to 15 of the 70+ gorillas I’ve been able to look at. From this meager sample, though, it looks like many aspects of mandible size may well end up correlating with aspects of body size. For instance, the distance from the back of the mandibular ramus to the front of the P4 is highly correlated with all 4 of Powell-Cotton’s bodily measures (right).

Will an expanded sample size uphold these high correlations? Will we see major differences between the sexes, or between different age groups? Will chimpanzees follow the same rules as gorillas? Hopefully I’ll be able to let you know by the time I’m done working in the museum!

Genes and culture in animals

Recent UM Ph.D. Kevin Langergraber and others (including UM primatologist John Mitani; 2010) recently reported on a high correlation between genetic relatedness and ‘cultural’ behavioral repertoire in wild chimpanzees.

Chimpanzees, and other animals, have been observed to display behaviors that appear ‘cultural,’ since the behaviors are variously a) learned from other individuals, b) specific to certain chimp populations, and/or c) not recognizably adaptive. Such behavioral variants include, for example, how hands are clasped during grooming (photo from Whiten, 2005), or whether/how insects are acquired.

Researchers have debated whether these behavioral variants actually represent culture, in the sense that humans have culture. This itself is tough because anthropologists have had a helluva time defining what ‘culture’ is simply for humans, let alone animals. I’m a bit anthropocentric myself, and I’m wont to view culture as something uniquely human, the adaptation (or set of adaptations) that has essentially shaped our evolution for over a million (2 million?) years.
Anyway, back to Pan, Langergraber and colleagues set out to test whether genetic variation may help explain some of the behavioral variation between different chimp populations. Lo and behold! there was a significant correlation between groups’ genetic dissimilarity and behavioral dissimilarity. This isn’t at all to say the authors have found the genetic basis for cultural behaviors, but rather that some genetic variation may underlie some behavioral variation we see in chimpanzees. Indeed, the authors note that the mtDNA used in the study doesn’t ‘code for’ any of the putatively cultural behaviors; it’s a proxy for genetic relatedness. However, there was no clear pattern of which types of behaviors (e.g. grooming- vs. feeding-related) correlate with genetic relatedness.
The results are a bit tough to interpret. The authors state that the finding of a correlation does not mean that many chimp behaviors analyzed are not cultural. But it doesn’t necessarily mean that the behaviors are cultural, either. This gets really tricky for a number of reasons.
First, identifying “the” or “a” genetic basis for phenotypes is difficult, and it’s especially difficult for complex phenotypes like behaviors (in general, if you ever hear about a “gene for” some behavior, immediately disbelieve it). The analysis uses an allegedly neutral DNA marker, that admittedly does not ‘code for’ any of the behaviors in question. All the DNA can do here is attempt to indicate relatedness among groups. To say that “genetic differences cannot be excluded as playing a major role” in patterning behavioral variation (p. 7), basically means that some unexamined genetic region may be patterned among populations the same way as the mtDNA marker, and might be responsible for specific, fine-tuned, non-adaptive aspects of their behavior. The authors discount the possibility of the link being due to kin teaching behaviors to kin, but I would suppose a higher resolution (like looking at relatedness and behavior between individuals rather than groups) would put that matter to rest.
Next, how much of a correlation is biologically (and here culturally?) meaningful? In various permutations of their analysis, the correlations between the behavioral and genetic dissimilarity matrices ranged from r = 0.37 – 0.52, most of which were significant. “Significant” here means that the correlation coefficients, r, are different enough from zero – there isn’t no relationship between the variables (I mean to say the double negative). Put another way, we can square the r coefficients to get the ‘amount of variance explained’: 13.7 – 27.0% of the behavioral dissimilarity can be ‘explained’ by genetic dissimilarity. What if the correlation coefficients had been higher – would this be better evidence for some genetic basis for chimp behavioral variants? I love correlation as much as the next guy, but aside from significance level, variation in linearity is not always completely understandable.
So, regardless of the results of the analysis, do apes (or other non-human animals) have culture? An interesting conundrum is that when people describe the subtle variants of behavior as cultural, they’re assuming the variation itself is non-adaptive, while the grand behavior itself purportedly is. Can things that are readily adaptive (ecological explanation) not also be cultural? Moreover, how widespread in a population must a behavioral variant be to be cultural? How many variants on a theme are permissible within a population? Questions like these are why I tend to shy away from the topic of culture, in humans and animals.
References
Langergraber K, Boesch C, Inoue E, Inoue-Murayama M, Mitani JC, Nishida T, et al. Genetic and ‘cultural’ similarity in wild chimpanzees. Proc R Soc B in press. Proc. R. Soc. B doi:10.1098/rspb.2010.1112 (2010)
Whiten A. 2005. The second inheritance system of chimpanzees and humans. Nature 437: 52-55.