A new year of bioanthro student blogging in Kazakhstan

A new year is upon us, our hair is a bit grayer and our telomeres a touch trimmer. Twenty effing fourteen.

It’s been a bit quiet here at Lawnchair, as I’ve been enjoying the holidays, but also writing a few things up for print. If I weren’t so old and wise, I’d make a New Year’s resolution to add to the blog more frequently. But I have a nascent career to attend to! So in the mean time, with the new year and semester, I’m adding two new courses to the Nazarbayev University bioanthro student blog that can hopefully keep you entertained & edumacated.

The wintry curtain rises for 2014 in Astana.

The wintry curtain rises for 2014 in Astana.

The first batch of student-written posts for the class “Bones, stones and genomes: Human Evolution” will go up on Monday. There will be a slight lull for a few weeks until this class, as well as “Monkey business: Primate behavior and ecology,” start posting in February. In addition to what’s already been posted by last year’s classes, the human evolution class will be adding posts focused on specific bones and fossils, while the primatology class will be adding article reviews/summaries.

So stay tuned to nazarbioanthro.blogspot.com in the coming months! (I should also have more fun new things to say here at Lawnchair, too)

This human DNA is old as hell

If hell were around 400,000 years old. The people who salvaged ancient DNA from fossil Neandertals and “Denisovans” now present mitchondrial DNA (mtDNA) from a human-ish fossils from the Spanish site of Sima de los Huesos (SH; this translates as “pit of bones,” by the way, which is pretty badass). DNA-bearing Neandertal sites and Denisova cave date anywhere from around 30-100 kya, while Sima de los Huesos has been dated by various methods to 300-600 thousand years ago. So the newly announced mtDNA is the oldest human DNA ever recovered…

YET!

Now, we know what Neandertals look like, since they are perhaps the best known group of fossil humans. We don’t really know what Denisovans look like, as their unique DNA came from fossils that are anatomically ambiguous (a large molar and the end of a tiny fragment of the bone at the end of your pinky finger) – they could look like anyone. Even you! The SH fossils predate Neandertals by a few hundred thousand years, but their skulls look pretty similar; quite possibly the SH populations were ancestors of Neandertals, and you’d expect the DNA to be similar in the two groups.

So researchers were surprised to find this SH mtDNA to be more similar to Denisovan than to human or Neandertal mtDNAs. But this actually shouldn’t be that surprising, since we saw the same twist when Denisovan mt and nuclear DNA was sequenced – mtDNA first made it look like humans and Neandertals were more closely related, and the ancestors of Denisovans separated from the human+Neandertal lineage in the deep past. However, mtDNA essentially acts as a single genetic locus – a gene tree isn’t necessarily a species tree – and the more informative nuclear DNA later showed Neandertals and Denisovans to be more closely related to one another than either was to living humans (yet each of these ancient populations contributed some genes to some living people today). Denisovans held on to a very ancient mtDNA lineage, and apparently so did the people represented at Sima de los Huesos. And let’s not forget, we don’t know what Denisovans looked like – maybe they looked just like the older SH fossils.

Hopefully we’ll be able to get human nuclear DNA from Sima de los Huesos. When we do, I predict we’ll see the same kind of twist as with the Denisova DNA, with SH being more similar to Neandertals. But if I’m wrong, maybe we’ll be a step closer to knowing what the bones of the the mysterious “Denisovans” looked like…

Here’s that paper: Meyer et al. in press. A mitochondrial genome sequence of a hominin from Sima de los Huesos. Nature. doi:10.1038/nature12788

Why the long face?

As was predicted long ago, and is becoming increasingly apparent, many anatomical differences between individuals are due not so much to the DNA coding for specific proteins (“genes”), but rather to the DNA that helps regulate when, where and how much these genes are expressed. A recent paper by Catia Attanasio and colleagues have identified thousands of these latter regions that appear to influence the development of facial shape, using a mélange of modern molecular, microscopic & morphometric methods. This is an exciting step toward understanding the genetic bases of facial variation within, and probably between, species.

Attanasio and colleagues identified “enhancers,” bits of DNA that enhance or increase the transcription of certain genes, relating to the embryonic development of the face. One interesting thing about these enhancers is that they aren’t usually found within the genes they enhance, but may be as far away as a few hundred thousand nucleotides. This is part of why these regulatory elements can be so hard to ascertain. What’s more, in the researchers’ own words, enhancers “often control the expression of their target genes in a modular fashion, where different enhancers activate the expression of the same gene in different cell types, anatomical regions, or at different developmental time points.” So in addition to the difficulty in finding enhancers, their varied ‘behavior’ makes it difficult to figure out exactly what each one does.

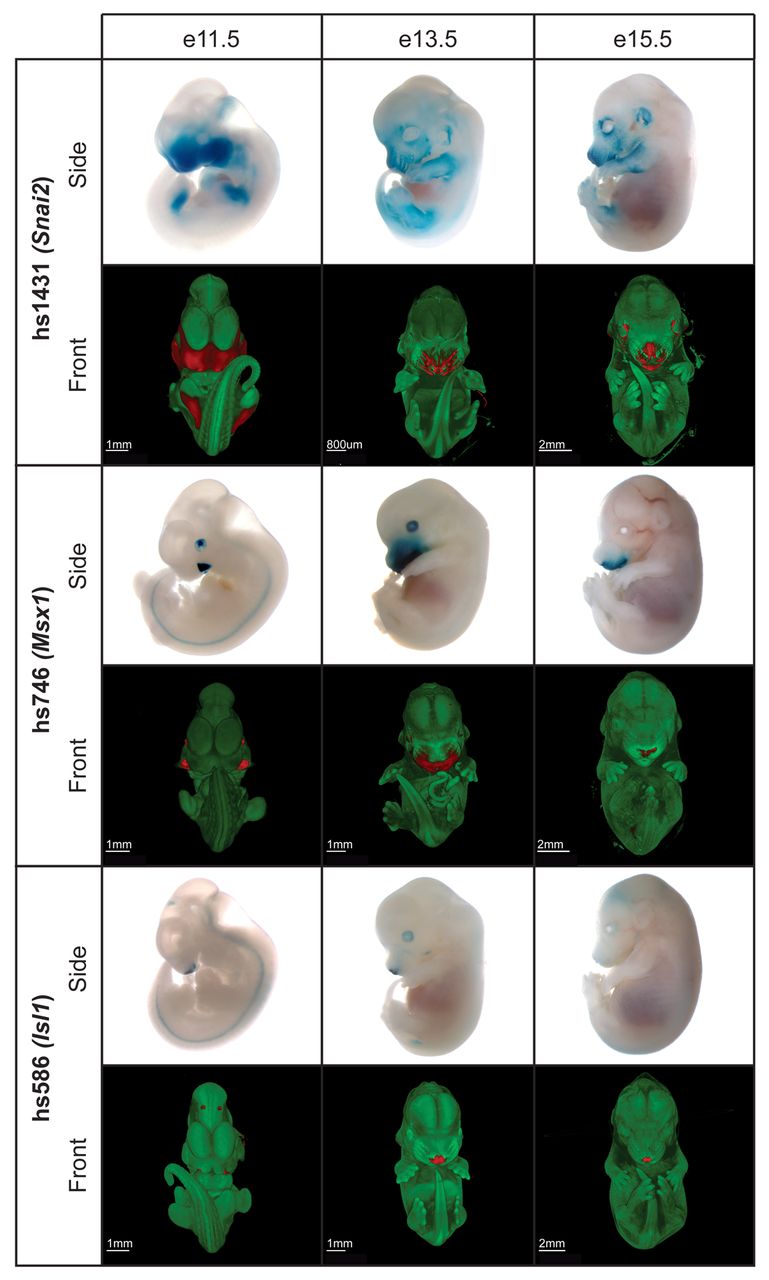
I won’t get into the methods they used to do this, but basically they were able to visualize when and where many of these enhancers were active in the developing face of mouse embryos. They also showed that tinkering with these enhancers had characteristic effects on bony facial shape in adults. The results are amazing:

Figure 5 from the paper. Blue/red indicate presence of a given enhancer. The white/blue images are actual mouse embryos, from younger (left) to older (right). Each green/red image is a 3D reconstruction of the blue/white embryo above, based on optical projection tomography.

Figure 5 from the paper. Blue/red indicate presence of a given enhancer. The white/blue images are actual mouse embryos, from younger (left) to older (right). Each green/red image is a 3D reconstruction of the blue/white embryo above, based on optical projection tomography.

Science has also made a very informative and visually stunning video to accompany the paper. Check it out. NOW.

So. Facial shape is the result of massively complex interactions between not just numerous genes, but also the coordination of thousands enhancers and other types of non-coding DNA regulating gene expression. Many other studies have tried to uncover the genetic bases of complex phenotypes (usually diseases) via genome wide association studies (GWAS), scanning genomes for shared genetic variants between individuals with similar phenotypes (I discussed this approach briefly Friday). In contrast to GWAS, what I really like about this study by Attanasio and colleagues is that they not only identify specific stretches of DNA as enhancers, but they also mapped their activity in developing embryos. Thus they could actually see how genetic variants contribute to phenotypes.

This is an important step toward understanding exactly how various genetic diseases affecting the face manifest. In addition, this and other studies uncovering the complex molecular interactions influencing facial shape could form the bases for computational models of development, to predict the genetic and developmental origins of facial evolution.

The paper: Attanasio C et al. 2013. Fine tuning of craniofacial morphology by distant-acting enhancers. Science 342: 1241006.

Is it worth seeking a genetic basis for math genius?

The topic this week in my Human Variation and Race class is intelligence. We’ve read about and discussed what intelligence is, how it is quantified, and the extent to which ‘intelligence,’ however defined, is biologically and/or environmentally determined. Intelligence (test score) has been shown to be heritable, meaning that a proportion of the variation in IQ test scores in a population can be explained by genetic variation. But that is not the same as saying that it is genetically determined. Similarly, complex traits such as intelligence, behaviors, and diseases almost never have a simple genetic basis – a common theme over at the Mermaid’s Tale, one that seems too rarely heeded. So you can imagine my surprise and delight at finding this news piece just published in Nature: “Root of maths genius sought: Entrepreneure’s ‘Project Einstein’ taps 400 top academics for their DNA.” Of course “roots” meant “genes.”

Apparently, bioinformatics entrepreneur and multimillionaire Jon Rothberg has set out to identify the genetic bases of peak mathletics, by analyzing the genomes of hundreds of mathematicians and physicists. Good luck, buddy! My initial reaction was to be appalled that an educated biologist these days could be such a flagrant biological determinist. What’s more, when approached about participating in the study, mathematician Curtis McMullen asked about the ethics of the project and its outcomes: “The uniform answer to my questions was that ‘we are not responsible for how the information is used after the study is completed.'” Ew. The project as briefly described reeked of some eugenics programme.

My prediction is that if this study takes off, Rothberg & buddies will be horribly disappointed. Assuming they are able to identify any genetic variants, these will probably only explain a small amount of variation in “maths genius.” Which itself is problematic, since there is probably not a single manifestation of math genius, and even if there were a single way to be a math genius, there may be several genetic pathways relating to the phenotype (not an uncommon finding of many genome-wide association studies). But hey, it seems to be Rothberg’s own money going into the study, so why not.

But then, if my prediction were to hold, this wouldn’t necessarily be a failure – it would point to an important role of society and learning environment in shaping individuals’ mathematic capability. And then maybe big money could begin to be diverted to more productive programs investigating and improving how people learn, rather than to large scale projects seeking simple answers when there isn’t necessarily any reason to expect them in the first place.

Osteology Everywhere: Head for the hills

Last week I was exploring central England with the brilliant Jess Beck, an archaeology PhD student at the University of Michigan. Both of us avid (nay, rabid) connoisseurs of everything skeletal, we espied the likes of a specific human bone in the scenic landscape of the the Cotswolds. Check out JB’s blog, Bone Broke, for her take on this geographical/geological/skeletal formation (as well as for lots of killer osteology and bioarchaeology tips and tricks). Do it now! NOW!

After you’ve checked out her site, behold this sight – what bone is lurking in the landscape?

osteourrywhere Cotswolds

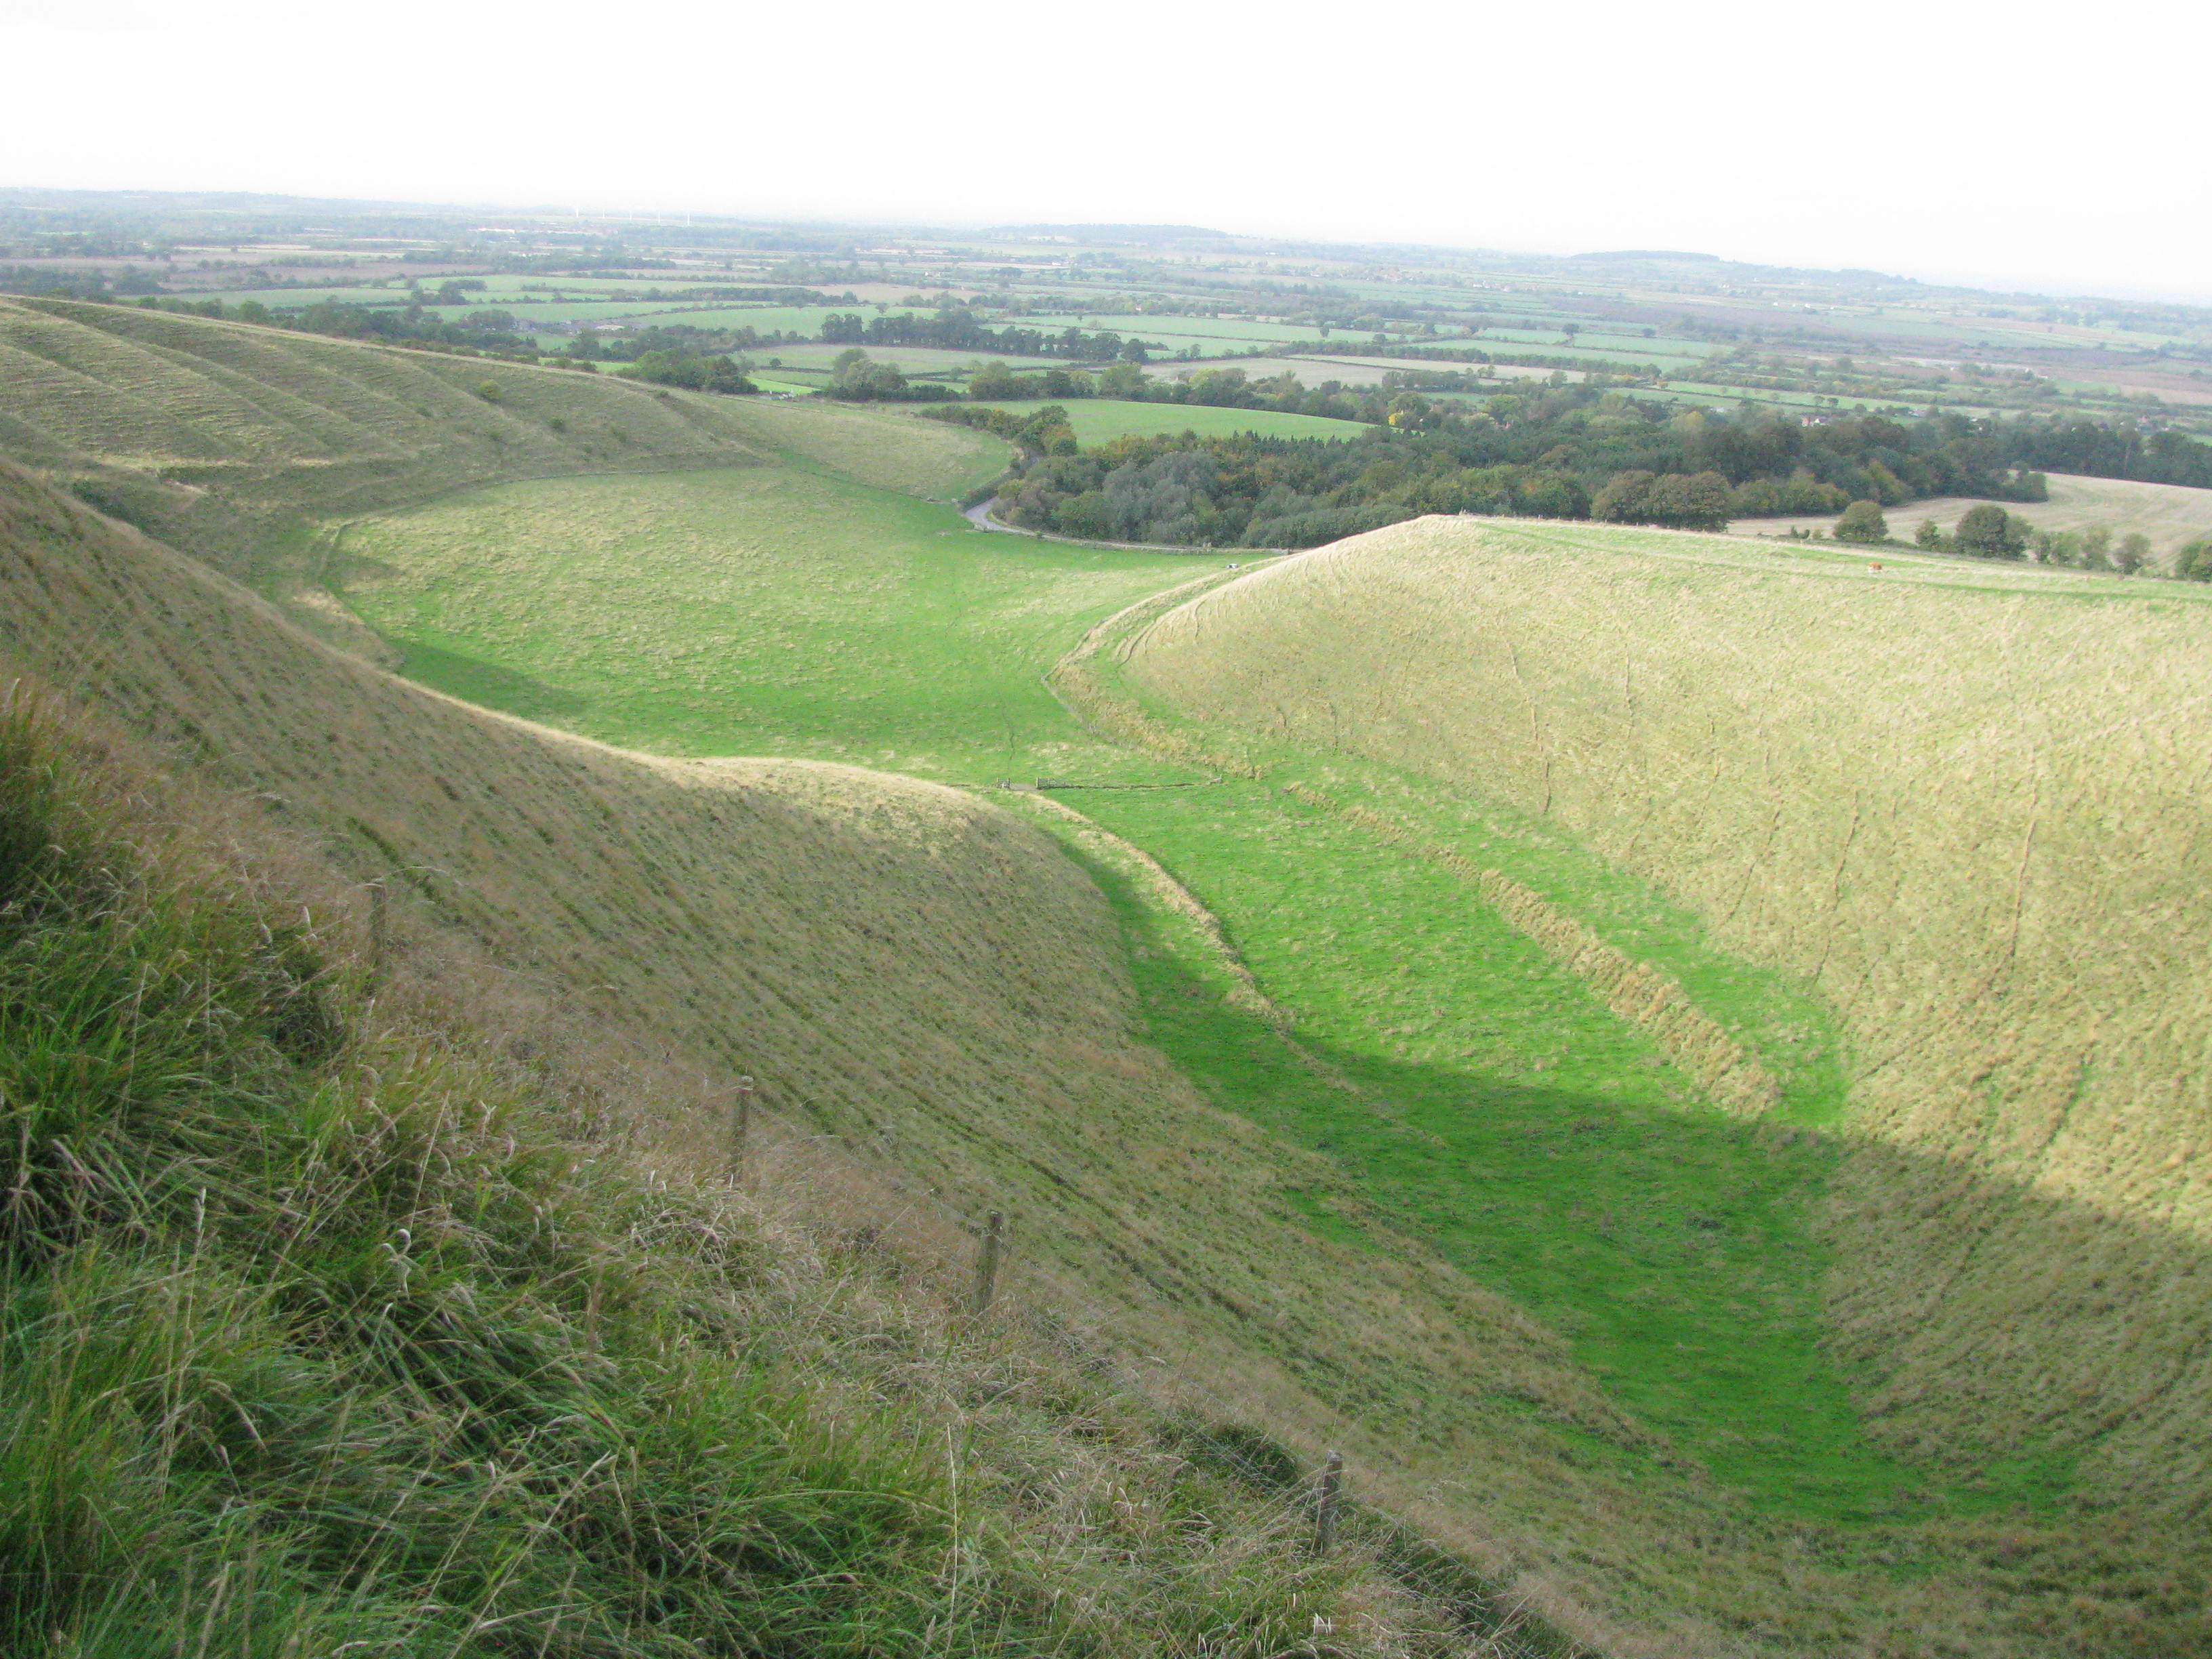
As with Rorschach inkblots, probably lots of bones could be seen in this image. But what Jess & I saw was a hamate, the greener hue hewn into the hills, whose sizable hamulus runs from the bottom right to join the rest of the carpal around the center of the image.

The hamulus of the hamate is an attachment point for the flexor retinaculum, the band of fascia stretching across your wrist to hold your extrinsic digital flexor muscles (or rather, their tendons) in place; you could think of it as the bridge covering the carpal tunnel. Now, comparing the grassy hamulus with an actual human one, you’ll spot two important differences: first, the grassy one isn’t blunt like the humans’, but ends in a long point. Oops! Just pretend it’s rounded off. Second, the grassy hamulus is huge relative to the overall size of the bone (or valley) compared with the human form. The size of the hamulus partially reflects the size of the carpal tunnel: chimpanzees, with powerful wrists and forearms, have long hamuli.

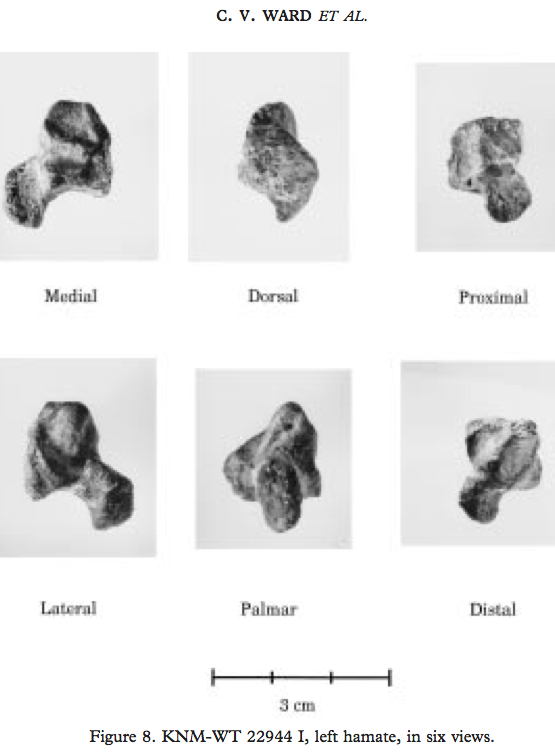
A huge nerd, I didn’t just see any hamate in this Cotswold vale. I also immediately thought of KNM-WT 22944, an Australopithecus afarensis hamate from the 3.5 million year old site of South Turkwel in Kenya (Ward et al., 1997):

WT 22944-Ward &al 1997

From Ward et al., 1999. Sorry it’s not in the same orientation as the above image. Hamulus is the projection pointing to the bottom left corner of the “medial” image.

An absolutely and relatively massive hamulus in WT 22944 suggests whoever this bone belonged to had some powerful gripping capabilities, while a geologically younger A. afarensis hamate from Hadar (AL 333-50) had a smaller, more human-like hamulus. Maybe (some) A. afarensis were still using their arms a lot for tree-climbing, in spite of being more than capable bipeds (I’ve talked about this before here)….

One final thought: People do like the way she says, “hamate.”

Ward et al., 1999. South Turkwel: a new pliocene hominid site in Kenya. Journal of Human Evolution 36: 69-95. link

White et al., 2012. Human Osteology 3rd Edition. link

The small, big new Dmanisi skull

The 5th skull early Homo skull from the site of Dmanisi was announced last week. The skull was discovered nearly 10 years ago, but is finally (and very comprehensively) published in Science (Lordkipanidze et al. 2013). The ‘new’ D4500 cranium goes with the massive D2600 mandible, making this the earliest and most complete skull of Homo that I know of. It’s really a remarkable specimen, for a number of reasons beyond its age and completeness. I’ve been busy traveling, teaching and writing lately, so I haven’t yet gotten to pore over the details as much as I’d like. So I hope to sporadically post thoughts on this badass new skull as they come to me. In the mean time, several of what I’d consider the top biology/anthropology blogs*** have discussed the skull, so do check those out if you haven’t already.

The first thing I noted about D4500 is its small brain size, estimated at a mere 546 cubic centimeters. For perspective, D4500 is the green point in the following plot showing brain size in early human evolution:

Endocranial volume for various fossil hominin fossils. 1: Australopithecus afarensis, africanus & boisei; 2: Dmanisi specimens; 3: "habilines" 4: early African Homo erectus; 5: Indonesian and Chinese Homo erectus

Endocranial volume for various fossil hominin fossils. 1: Australopithecus afarensis, africanus & boisei; 2: Dmanisi specimens; 3: “habilines” 4: early African Homo erectus; 5: Indonesian and Chinese Homo erectus. D4500 is green with envy.

I got to see (but not study) the cranium a few years ago when I was helping with the Dmanisi Paleoanthropology field school, and I remember noting just how “robust” the specimen was – big mastoid processes, prominent and thick brow ridge, huge attachments for the neck muscles. In humans, and presumably our fossil forebears, these features are more developed in males than females, and so presumably D4500 was a male (consistent with the huge, associated D2600 mandible). In many primates, and 4 to ~1 mya hominins so far as we can tell, males are larger than females. So it is surprising that a robust probable male cranium is in fact not only the smallest in the Dmanisi sample, but also at the low end of early African Homo (i.e. habilis or rudolfensis), comparable to the largest australopiths. Of course, the only other faces known from Dmanisi are either not fully grown (D2700 and D2282) or old and decrepit (D3444), so perhaps the larger-brained specimens would have been at least as robust as D4500. An untestable hypothesis!

The new skull really highlights the overlap, or continuous variation between later australopiths and early Homo known also from eastern Africa. In association with the postcranial remains known from Dmanisi, the authors the paper posit that early Homo may have been distinguished from Australopithecus not so much in brain size as in body size. We could probably add body shape (limb proportions) and tool use to that list of distinguishing features, and to be sure there are Oldowan tools and small but human-like body size and shape indicated by postcrania at Dmanisi. But then, evidence for body proportions and for/against tool use in Australopithecus, especially later in the record, is somewhat equivocal…

More thoughts to follow.

*** https://blogs.wellesley.edu/vanarsdale/2013/10/17/uncategorized/the-new-wonderful-dmanisi-skull/; http://johnhawks.net/weblog/fossils/lower/dmanisi/d4500-lordkipanidze-2013.html; http://ecodevoevo.blogspot.com/2013/10/how-many-human-species-are-there-is-it.html

Reference: David Lordkipanidze, Marcia S. Ponce de León, Ann Margvelashvili, Yoel Rak, G. Philip Rightmire, Abesalom Vekua, and Christoph P. E. Zollikofer. 2013. A Complete Skull from Dmanisi, Georgia, and the Evolutionary Biology of Early Homo. Science: 342 (6156), 326-331.

More FREE badass bioanthro science resources!

Hark! There’s been quite a long silence here, as I’ve been busy preparing manuscripts related to this post and this post. Also teaching; my new Intro to Biological Anthropology students are writing posts over at nazarbioanthro.blogspot.com – check them out!

Anyway, some more FREE DATA have come to my attention that I figured people may find useful (I’ve posted links to other great resources here and here).

First, my buddy and advisor Milford Wolpoff has helped compile an open online dental dataset. This consists of length and breadth measurements for teeth from humans, fossil humans and non-human apes. And promises of more to come! You can read about the data, and online data-sharing more generally, in this paper at the Paleoanthropology Society website.

Secondably, Herman Pontzer has put together a website, Australopithecus, with lots of great information about human evolution for teachers and students, as well as a datamine of links and metrics and pictures of fossil hominins and apes. Pretty boss.

Third, announced in the American Journal of Physical Anthropology just yesterday is a database of cranial non-metric data, pioneered by Nancy Ossenberg. This is a very comprehensive dataset, with info about up to 84 non-metric traits on over 8,000 individual crania from all over the world. Ossenberg also links to the WW Howells craniometric dataset (thousands of cranial measurements of individuals all over dodge); I’m not sure if/how much Ossenberg’s and Howells’ datsets overlap, but the covariance of size, shape and non-metric traits could be a very interesting investigation (if it hasn’t been done already; sorry for my ignorance!).

Finally, if you’re looking to analyze these or any other tantalizing data, you’ll want to download and learn to use R. This free statistical computing program will let you analyze pretty much anything with either traditional statistics, or you can be a badass and make up your own custom tests. I’ve been blabbing incessantly about how awesome this program is since at least 2009, but here’s the link just in case. takes some time to figure out how to use, but its help files are all online, and you can probably find out how to do anything else your dreams can concoct on the Internets.

Now you are ready to take on the world. Go forth!

Mandible as a measure of overall body size?

I’m currently in Kent, United Kingdom, examining African ape jaws to follow up on my dissertation research comparing jaw growth in humans and Australopithecus robustus (having a tough time writing this stuff up for journal publication, but hopefully things’ll start coming out soon). One thing I’d assumed (with evidence, of course), was that aspects of mandibular size could serve as a proxy for body size, to make inferences about body growth. Now that I’m in Kent, I’m hoping to get good evidence of this in the non-human African apes.

The Powell Cotton Museum in Kent has an awesome collection of chimpanzees and gorillas (see the Human Origins Database by Adam Gordon and Bernard Wood for more information on these samples). This collection was accumulated during a time last century when explorers would go out and collect specimens from the wild, usually by finding and killing them. Now, when Major Percy Powell-Cotton was out doing this, he or some of his assistants actually collected measurements on some of the corpses – arm span, height, head+body length, and chest girth. This means we can see which aspects of the mandible correlate with body size, which is important since the fossil record usually affords us mandibles more than any other part of the skeleton.

Length of the back of the ramus to the P4, plotted against measures of body size.

Length of the back of the ramus to the P4, plotted against measures of body size. Colors/shapes represent 1 of 5 dental eruption age groups.

There aren’t body size measurements for all individuals, and I’ve been biasing my own sampling toward subadults. So I only have body size data for up to 15 of the 70+ gorillas I’ve been able to look at. From this meager sample, though, it looks like many aspects of mandible size may well end up correlating with aspects of body size. For instance, the distance from the back of the mandibular ramus to the front of the P4 is highly correlated with all 4 of Powell-Cotton’s bodily measures (right).

Will an expanded sample size uphold these high correlations? Will we see major differences between the sexes, or between different age groups? Will chimpanzees follow the same rules as gorillas? Hopefully I’ll be able to let you know by the time I’m done working in the museum!

Molar? I hardly even know her!

I was recently at the State Zoology Museum of Munich, studying their amazing plethora of orangutan bones. Jaw bones are especially useful skeletal remains when you study growth, because different teeth come in at different points in one’s life. Remember when your 1st permanent molar teeth came in? You were probably 5 or 6 years old at the time. It was a big deal, your first permanent teeth! What about your 4th permanent molars, after your wisdom teeth, remember those?

An adult male orangutan mandible, with bilateral supernumerary molars. Or more simply, “an extra molar on both sides of the jaw.”
I hope not. As a good eutherian, you should never have more than 3 molars in each half of each jaw. And as a modern human, there’s a good chance you’ve only got 2 in each half (but that’s a whole other story). So when I was looking at orangutan skulls to get an idea of individuals’ ages, I was shocked to find skull after skull with at least one extra molar. So far as I could tell, 27 out of 181 (14.9%) adult orangutans in this collection had extra molars.
Supernumerary (fancy word for “extra”) molars manifest a number of ways in this collection. Sometimes there’s only one extra tooth. Sometimes there are extra teeth in both upper and lower jaws but only on one side. Sometimes there’s a full set (4). Et cetera. One poor lil guy even had a 5th molar lurking behind one of his four 4ths! That’s too many extra molars.
An adult male with a fairly normal 4th (blue arrow) and even a weird, unerupted 5th (red arrow) molar. Gross!
This is rather strange, such a regular occurrence of supernumerary teeth – what gives? A starting clue is the fact that all skulls with extra molars are of the species Pongo pygmaeus from Borneo (173 of 181 skulls). The remaining eight skulls, with a normal dental formula, are Pongo abelii from the island of Sumatra. But how much of this difference in frequency is due to the fact we’re looking at 181 Bornean, vs. only eight Sumatran orangutans?
One way to address this with a Chi-squared test (χ2), but why be normal (pun!) when you could play around with resampling in R? Is it weird that 27/181 (15%) Bornean orangutans have extra teeth, while 0/8 Sumatran orangs do not? Another way to ask the question is, what are the chances of sampling 8 Bornean orangs, none of which have extra molars? This is very easy to program and test in R:
Set up a vector (basically, a string of numbers) to represent your Bornean orangs, each entry representing an individual, assigning “0” for no extra teeth and “1” for at least one (this admittedly oversimplifies the nature of extra teeth). Then simply randomly sample – lots and lots of times –  eight individuals from this Bornean vector, to see how often you get a set in which 0/8 have extra molars.
“b” is our vector of Bornean orangutans, consisting of 0s and 1s for whether there are extra teeth. “n” tells us how many individuals had extra teeth in that subsample. The “(i in 1:10000)” means for each of 10,000 resamplings.
Following this resampling procedure, there’s about a 25.5% chance that none of them will have extra molars. That means the remaining 74.5% of the time, a random subsample of the Bornean orangutans will contain at least one individual with at least one extra tooth.
A number of interesting questions arise from this – if we were to examine more Sumatran orangutans, would we eventually find one with an extra molar? After all, the 25.5% chance of sampling 0/8 suggests maybe we just missed some Sumatrans with extra molars. Regardless, within the Bornean orangs, why is the frequency so high? Does one pattern of extra teeth (say, just in the lower jaw, or on both sides, etc.) predominate? Are there differences between the sexes? These are questions for another day….

Update: Brain growth in Homo erectus, and the age of the Mojokerto fossil

The Mojokerto calvaria. You’re looking at the left side of the
 skull: the face would be to the left. Check it out in 3D here.

A few months ago I posted an abridged version of the presentation I gave at this year’s meetings of the American Association of Physical Anthropologists, about brain growth in Homo erectus. This study, co-authored with Jeremy DeSilva, adopts a novel approach (see “Methods” in that earlier post) to analyze the Mojokerto fossil (right). The specimen is the only H. erectus non-adult complete enough to get a decent estimate of brain size (or rather, the overall volume of the brain case) – probably 630 to 660 cubic centimeters (Coqueugniot et al. 2004; Balzeau et al., 2004). So to study brain growth in the extinct species, we just have to connect a range of estimated brain sizes at birth (around 290 cubic centimeters, based on predictive equations by DeSilva and Lesnik, 2008) to that of Mojokerto. But, the speed of brain growth implied by this comparison depends on how old poor Mojokerto was when s/he died.

Most recently, Hélen Coqueugniot and colleagues (2004) used CT scans of the fossil to examine the fusion of its various bones, to suggest the poor kid died between six months to 1.5 years, if not even younger. Antoine Balzeau and team (2005) also studied scans of the fossil, and their analysis of its virtual endocast presented conflicting age estimates, but they argued the poor kid was probably no older than 4 years. Earlier studies had suggested the kid was up to 8 years. Now, for my previous post/conference presentation, we assumed the Coqueugniot estimate was correct – but what if we consider a full range of ages for Mojokerto, from 0.03-6.00 years?

Brain size, relative to newborns’ values, at different ages in humans (black circles) and chimpanzees (red triangles). Homo erectus median and mean are the thick solid and dashed blue lines, respectively, and the 90% and 95% confidence intervals are indicated by the thinner, dotted blue lines. Data are the same as in the previous post.

The plot above depicts brain size relative to newborns: each circle (humans) and triangle (chimpanzees) represents the proportional size difference between a newborn (less than 1 week) and an older individual, up to 6 years. Obviously, relative brain size gets bigger in humans and chimpanzees over time. Interestingly, even though humans and chimps have very different brain sizes, the proportional brain size changes overlap a lot between species, especially at younger ages. Ah, the joys of cross-sectional samples.

But what’s especially interesting here are the blue lines on the graph, indicating estimates of proportional size change in Homo erectus, assuming Mojokerto’s skull could hold 630 cc of delicious brain matter, and that the species’ skulls at birth could hold about 290 cc, give or take several cc. The thick solid and dashed lines just above 2 on the y-axis are the mean and median of our estimates – Mojokerto’s brain averages around 2.2 times larger than predicted newborns. Such a proportion is most likely to be found in humans between 6 months to a year of age, and in chimpanzees between around 6 months and 2 years. The confidence intervals, the highest and lowest bounds of our estimates for Homo erectus proportional size change, are the thinner dashed lines on the graph. They help us constrain our estimates, and further suggest that the proportional difference found for H. erectus is most likely to be found in either chimpanzees or humans around 1 year of age – just like Coqueugniot and colleagues predicted!!!

Thus, independent evidence – brain size of Mojokerto and estimated brain size at birth in Homo erectus – corroborates a previously estimated age at death for the Mojokerto fossil, the poor little Homo erectus baby. This further supports our estimates of brain growth rates in this species, as described in the previous post.

ResearchBlogging.orgSo to summarize, fairly scant fossil evidence compared with larger extant species samples using randomization statistics, argue for high, human-like infant brain growth rates in Homo erectus by around 1 million years ago. Our ancestors were badasses.

Remember, if you want the R code I wrote to do this study, just lemme know!

Those references
Balzeau A, Grimaud-Hervé D, & Jacob T (2005). Internal cranial features of the Mojokerto child fossil (East Java, Indonesia). Journal of human evolution, 48 (6), 535-53 PMID: 15927659

Coqueugniot H, Hublin JJ, Veillon F, Houët F, & Jacob T (2004). Early brain growth in Homo erectus and implications for cognitive ability. Nature, 431 (7006), 299-302 PMID: 15372030

DeSilva JM, & Lesnik JJ (2008). Brain size at birth throughout human evolution: a new method for estimating neonatal brain size in hominins. Journal of human evolution, 55 (6), 1064-74 PMID: 18789811