For the first time in many years, I’m offering a new advanced undergrad seminar here at Vassar. When I arrived here 8 years ago, I was mainly thinking about Homo naledi and ontogeny, so those were the foci of my seminars. But my research has begun looking more at brain evolution and especially the evidence from fossil endocasts, and there is a lot of literature I need to catch up on.
So I’ve invited students along for this brainstorm, using the question “Is the human brain special?” as a starting point to learn about how the beautifully congealed soup sloshing around inside our skull makes us such quirky animals. In the first half of the semester we’ll read up on brain anatomy and structure, and students will use some of the fossil endocast data I’ve accrued over the years to learn more about a given brain region and extinct hominin. In the second half of the semester we’ll read about the brains, behavior, and endocast fossils of very distant relatives — invertebrates, birds, whales, and dogs — that have been celebrated for their own ‘advanced intelligence.’ We’ll also read about how the evolution of our brains may have predisposed us to certain conditions like addiction and Alzheimer’s, and how brain science has been exploited toward racist and sexist ends (increasingly relevant in America today, sadly).
It will be a lot of work (I’m a very slow, distractible reader) but I’m excited to delve into this literature and see what insights our super sharp students here at Vassar come up with in discussions and projects. The course syllabus (ANTH 323) is available on my Teaching page — I’d be keen to hear suggestions for readings and assignments from folks who know more about brains than I do!
In the Summer of 2019 I worked with some great Vassar undergrads to make virtual endocasts and generate new brain size estimates for the Neandertals from the site of Krapina, which we then published in 2021 (discussed in this blog post). The virtual approach to endocast reconstruction uses 3D landmark-based geometric morphometrics methods, and so in the spirit of open science we also published all the landmark data used for the study (as well as a bunch of other fossil human brain size estimates) in the Zenodo repository (here).
Neandertal fossil specimens Krapina 3 (purple/green) and Krapina 6 (yellow/red) with preserved landmarks and virtually reconstructed endocasts.
Something major and global happened around that time — who can even remember what? — and so I never got around to posting R code to accompany the study. So, I’ve finally gotten around to adding some very basic code to the Zenodo entry (better late than never). The code simply reads in the landmarks, estimates missing data for fossils, and does some very basic shape analysis and visualization. It’s doesn’t get into all the nuts and bolts of our study, but it should be enough to help folks check our data or get started with shape analysis in R.
R code includes ways to visualize the landmark data. Left: Principal components analysis graph of endocast shape for humans (red) and Neandertals (blue). Right: Triangle meshes of the average human and Neandertal endocast shapes, viewed from the right, bottom, and back.
Original article Cofran Z, Boone M, Petticord M. 2021. Virtually estimated endocranial volumes of the Krapina Neandertals. American Journal of Physical Anthropology 174: 117–128. (link)
I’m working on a project analyzing infant remains of Homo naledi, a species of human that lived in South Africa around 300,000 years ago. In order to paint a full picture of infancy in this species, we need to estimate how big (or small) naledi newborns were. But without fossil neonates that could provide direct evidence of body size at birth, this is a tricky task.
Ideally, we could simply use adult body size estimates for Homo naledi to predict its body size at birth, using the scaling relationship in other primates as a guide. For example, using an average adult body size of 44 kg for Homo naledi (Garvin et al., 2017) yields an estimated newborn size of around 1.5 kg, based on published primate dataset (Barton and Cappellini, 2011). But this approach necessarily overlooks variation within each species, not to mention variation and uncertainty in Homo naledi adult size. In addition, the 95% prediction interval for this estimate ranges from under 1 kg (smaller than an average baboon baby) to almost as large as a human neonate.
Primate body size scaling (Barton & Cappellini, 2011). The black line is the regression for catarrhines (purple squares and blue circles), and the shaded grey area is the 95% prediction interval for newborns at a given adult catarrhine size.
And this gets at the other issue with the regression-based approach to estimating newborn body size in fossil hominins: humans are bad at being primates in some ways, as illustrated here by the fact that we don’t fit the newborn-adult body size relationship that characterizes other catarrhines (apes and monkeys of Africa and Eurasia).
Humans give birth to collosal kids. In contrast, gorillas are the largest living primates as adults, but their newborns are only a little over half the size of human neonates. Why do we have such giant babies? The most proximate reason is that humans are born with adult-ape-sized brains and quite a bit of baby fat as far as mammals go (Kuzawa, 1998). This tells us how babies are big, but it still begs the ultimate question of why—an enduring puzzle that you may have read about in the New York Times last week.
In order to land on a reasonable estimate of newborn body size in extinct humans, we need to figure out when evolution blew up the kid. Unfortunately, the only fossil hominin neonates are two Neandertals from France and Russia dating to under 100,000 years ago—pretty remarkable, but they don’t necessarily tell us about earlier species like Homo naledi.
My colleague Jerry Desilva (2011) worked out a potential solution to this conundrum. He argued that one could work from adult brain size to newborn body size through the following steps. First, in contrast to newborn-adult body size scaling, humans are good catarrhines when it comes to newborn-adult brain size scaling. This means that we can reasonably estimate newborn brain size based on adult brain sizes, which are aplenty in the human fossil record. Second, humans and many other primate newborns have brains roughly 12% of their overall body mass, while the great ape newborns stand out with brains around 10% of their adult size. Putting these two pieces together, one could estimate newborn body size: Adult brain ➡️ newborn brain ➡️ 10–12% newborn body size
DeSilva showed that regardless of whether you use an ape or human model of newborn brain/body size, hominin babies from Australopithecus afarensis 3 million years ago onward were probably large relative to maternal body size, estimated independently using skeletal remains. It’s a bit of a tortuous approach to estimating body size at birth, but the assumptions are reasonable and it’s probably the best way to figure out this important life history variable given the fossil evidence. What does this mean for Homo naledi?
Virtual reconstruction of brain size and shape of the Homo naledi cranium “Neo” (work in progress). At 610 cm3, this is the largest and most complete Homo naledi endocast.
There are a few reliable adult brain size estimates for naledi, ranging from 465–610 cm3 (Berger et al., 2015; Garvin et al., 2017; Hawks et al., 2017), which based on catarrhine scaling would predict newborn brain size of around 170–210 cm3 (DeSilva and Lesnik, 2008). These brain sizes would then predict newborn body sizes of around 1.4–2.1 kg: the smol estimate is based on the smallest naledi adult brain size and a human model of newborn brain/body size; the chonk estimate is based on the largest naledi brain size and an ape brain/body model (pinkish stars in the boxplot below, left).
Boxplots of newborn body size in great apes. Gorilla, Chimpanzee, and Bonobo data from the Primate Aging Database(Kemnitz, 2019).
So, did Homo naledi have big babies? On the one hand, no: these 1.4–2.1 kg naledi newborns are outside the human range, and within the range of living great apes.
On the other hand, maybe Homo naledi babies were relatively large, though this depends on the size of Homo naledi adults. Recall from earlier that Garvin and colleagues arrived at an average estimated adult size of 44.2 kg. But this is an average of estimates for 20 separate naledi fossils, and each of these estimates has its own range of uncertainty. Garvin and team reported that the extremes of the prediction intervals for these estimates ranged from 28–62 kg. The second boxplot above shows newborn size relative to the adult average (sexes combined) for each species: for naledi, the six labels compare the smol and large newborn sizes (1.4 and 2.1 kg) with the adult average and extremes (28, 44, and 62 kg). Assuming the ‘true’ naledi sizes are somewhere in the middle of the range of estimates, naledi likely gave birth to babies 3–5% of adult body size, somewhat ‘intermediate’ between chimpanzees and humans (and bonobos…?) and similar to what DeSilva found for other hominins.
This is just a preliminary look at infancy in Homo naledi. There is a lot of uncertainty in these size estimates, but we should still be able to make some interesting inferences about growth and life history in our extinct evolutionary cousin.
REFERENCES
Barton, R. A., & Capellini, I. (2011). Maternal investment, life histories, and the costs of brain growth in mammals. Proceedings of the National Academy of Sciences, 108(15), 6169–6174. https://doi.org/10.1073/pnas.1019140108
Berger, L. R., Hawks, J., de Ruiter, D. J., Churchill, S. E., Schmid, P., Delezene, L. K., … Zipfel, B. (2015). Homo naledi, a new species of the genus Homo from the Dinaledi Chamber, South Africa. ELife, 4, e09560. https://doi.org/10.7554/eLife.09560
DeSilva, J. M. (2011). A shift toward birthing relatively large infants early in human evolution. Proceedings of the National Academy of Sciences, 108(3), 1022–1027. https://doi.org/10.1073/pnas.1003865108
DeSilva, J. M., & Lesnik, J. J. (2008). Brain size at birth throughout human evolution: A new method for estimating neonatal brain size in hominins. Journal of Human Evolution, 55(6), 1064–1074. https://doi.org/10.1016/j.jhevol.2008.07.008
Garvin, H. M., Elliott, M. C., Delezene, L. K., Hawks, J., Churchill, S. E., Berger, L. R., & Holliday, T. W. (2017). Body size, brain size, and sexual dimorphism in Homo naledi from the Dinaledi Chamber. Journal of Human Evolution, 111, 119–138. https://doi.org/10.1016/j.jhevol.2017.06.010
Hawks, J., Elliott, M., Schmid, P., Churchill, S. E., Ruiter, D. J. de, Roberts, E. M., … Berger, L. R. (2017). New fossil remains of Homo naledi from the Lesedi Chamber, South Africa. ELife, 6, e24232. https://doi.org/10.7554/eLife.24232
Kuzawa, C. W. (1998). Adipose tissue in human infancy and childhood: An evolutionary perspective. American Journal of Physical Anthropology, 107(S27), 177–209. https://doi.org/10.1002/(SICI)1096-8644(1998)107:27+<177::AID-AJPA7>3.0.CO;2-B
Each year in my intro bio-anthro class, we start the course by asking how our brains contribute to making us humans such quirky animals. Our first lab assignment in the class uses 3D models of brain endocasts, to ask whether modern human and fossil hominin brains are merely primate brains scaled up to a larger size. In the Before Times, students downloaded 3D meshes that I had made, and study and measure them with the open-source software Meshlab. But since the pandemic has forced everyone onto their own personal computers, I made the activity all online, to minimize issues arising from unequal access to computing resources. And since it’s all online, I may as well make it available to everyone in case it’s useful for other people’s teaching.
The lab involves taking measurements on 3D models on Sketchfab using their handy measurement tool, and entering the data into a Google Sheets table, which then automatically creates graphs, examines the scaling relationship between brain size (endocranial volume, ECV) and endocast measurements, and makes predictions about humans and fossil hominins based off the primate scaling relationship. Here’s the quick walk-through:
Go to the “Data sources” tab in the Google Sheet, follow the link to the Sketchfab Measurement Tool, and copy the link to the endocast you want to study (3D models can only be accessed with the specific links).
Following the endocast Sketchfab link (column D) will bring you to a page with the 3D endocast, as well as some information about how the endocast was created and includes its overall brain size (ECV in cubic cm). Pasting the link when prompted in the Measurement Tool page will allow you to load, view, and take linear measurements on the endocast.
Hylobates lar endocast, measuring cerebral hemisphere length between the green and red dots.
Sketchfab makes it quite easy to take simple linear measurements, by simply clicking where you want to place the start and end points. The 3D models of the endocasts are all properly scaled, and so all measurements that appear in the window are in millimeters.
The assignment specifies three simple measurements for students to take on each endocast (length, width, and height). In addition, students get to propose a measurement for the size of the prefrontal cortex, since our accompanying reading (Schoenemann, 2006) explains that it is debated whether the human prefrontal is disproportionately enlarged. All measurements are then entered into the Google Sheet — I wanted students to manually enter the ECV for each endocast, to help them appreciate the overall brain size differences in this virtual dataset (size and scale are often lost when you have to look at everything on the same-sized 2D screen).
Feel free to use or adapt this assignment for your own classes. The assignment instructions can be found here, and the data recording sheet (with links to endocast 3D models) can be found here — these are Google documents that are visible, but you can save and edit them by either downloading them or making a copy to open in Docs or Sheets.
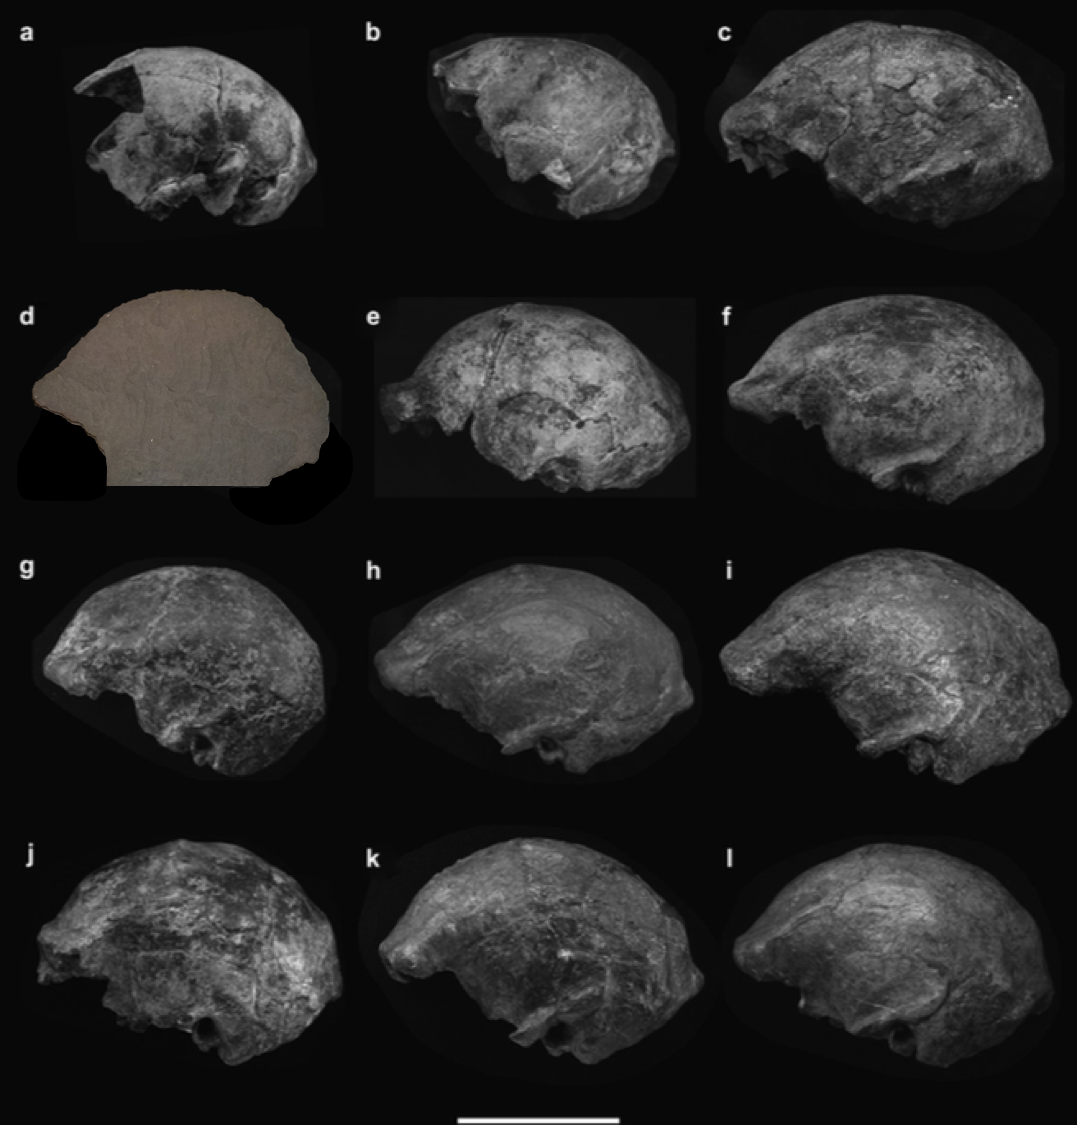
It’s the end of the year and I’ve got Homo erectus on the brain somethin fierce. Our precedent-erect first popped up in Africa around 1.9 million years ago, quickly spread throughout much of the Old World, and persisted until perhaps as late as ~ 100,000 years ago in Java, Indonesia. This was a very successful species by all accounts, and as a result of its great range and duration, you can imagine it was also pretty variable.
Hominin brain sizes. Boxes and whiskers represent sample tendencies and points are individual specimens. 1 = Australopithecus, 2 = Early Homo (cf. habilis & rudolfensis), 3 = Dmanisi H. erectus, 4 = Early African H. erectus, 5 = Early Indonesian H. erectus, 6 = Chinese H. erectus, 7 = Later Indonesian H. erectus, 8 = modern humans.
Despite this great variation, H. erectus skulls generally share a common visage: long and low cranial vault, low forehead, protruding brow ridges, fun tuberosities and tori in the back. You’d recognize them anywhere. Including the sidewalk!
Homo erectus in front of Ploenchit Tower, Bangkok (lateral view, front is to the right).
The relief in this sidewalk slat superficially looks like a trace fossil of partial H. erectus cranium, the face either missing (from the lower right) or taphonomically displaced toward the left side of the tile (see here for actual H. erectus trace fossils). This looks really similar to H. erectus from Indonesia, not surprising given its discovery in Thailand. Why, it could have come straight out of Figure 6 from a 2006 paper by Yousuke Kaifu and colleagues:
Left lateral views of Javanese H. erectus crania, modestly modified from Kaifu et al. (2006: Fig. 6). Front is to the left this time.
Using my insane photo editing skills, I’ve inserted the Ploenchit Tower trace fossil (reversed) within the horde of heads presented by Kaifu et al., above. Like many of the real fossils, the Ploenchit specimen is missing the face (due to taphonomy), the supraorbital torus or brow ridge juts out from a low-rising forehead, and the occipital bone also projects out about from the otherwise rounded contour of the cranium. Note that there is a good deal of variation in each of these features among the real fossils.
What a happy holiday accident to find a Homo erectus cranium on the street!
Reference Kaifu Y, Aziz F, Indriati E, Jacob T, Kurniawan I, & Baba H (2008). Cranial morphology of Javanese Homo erectus: new evidence for continuous evolution, specialization, and terminal extinction. Journal of human evolution, 55 (4), 551-80 PMID: 18635247
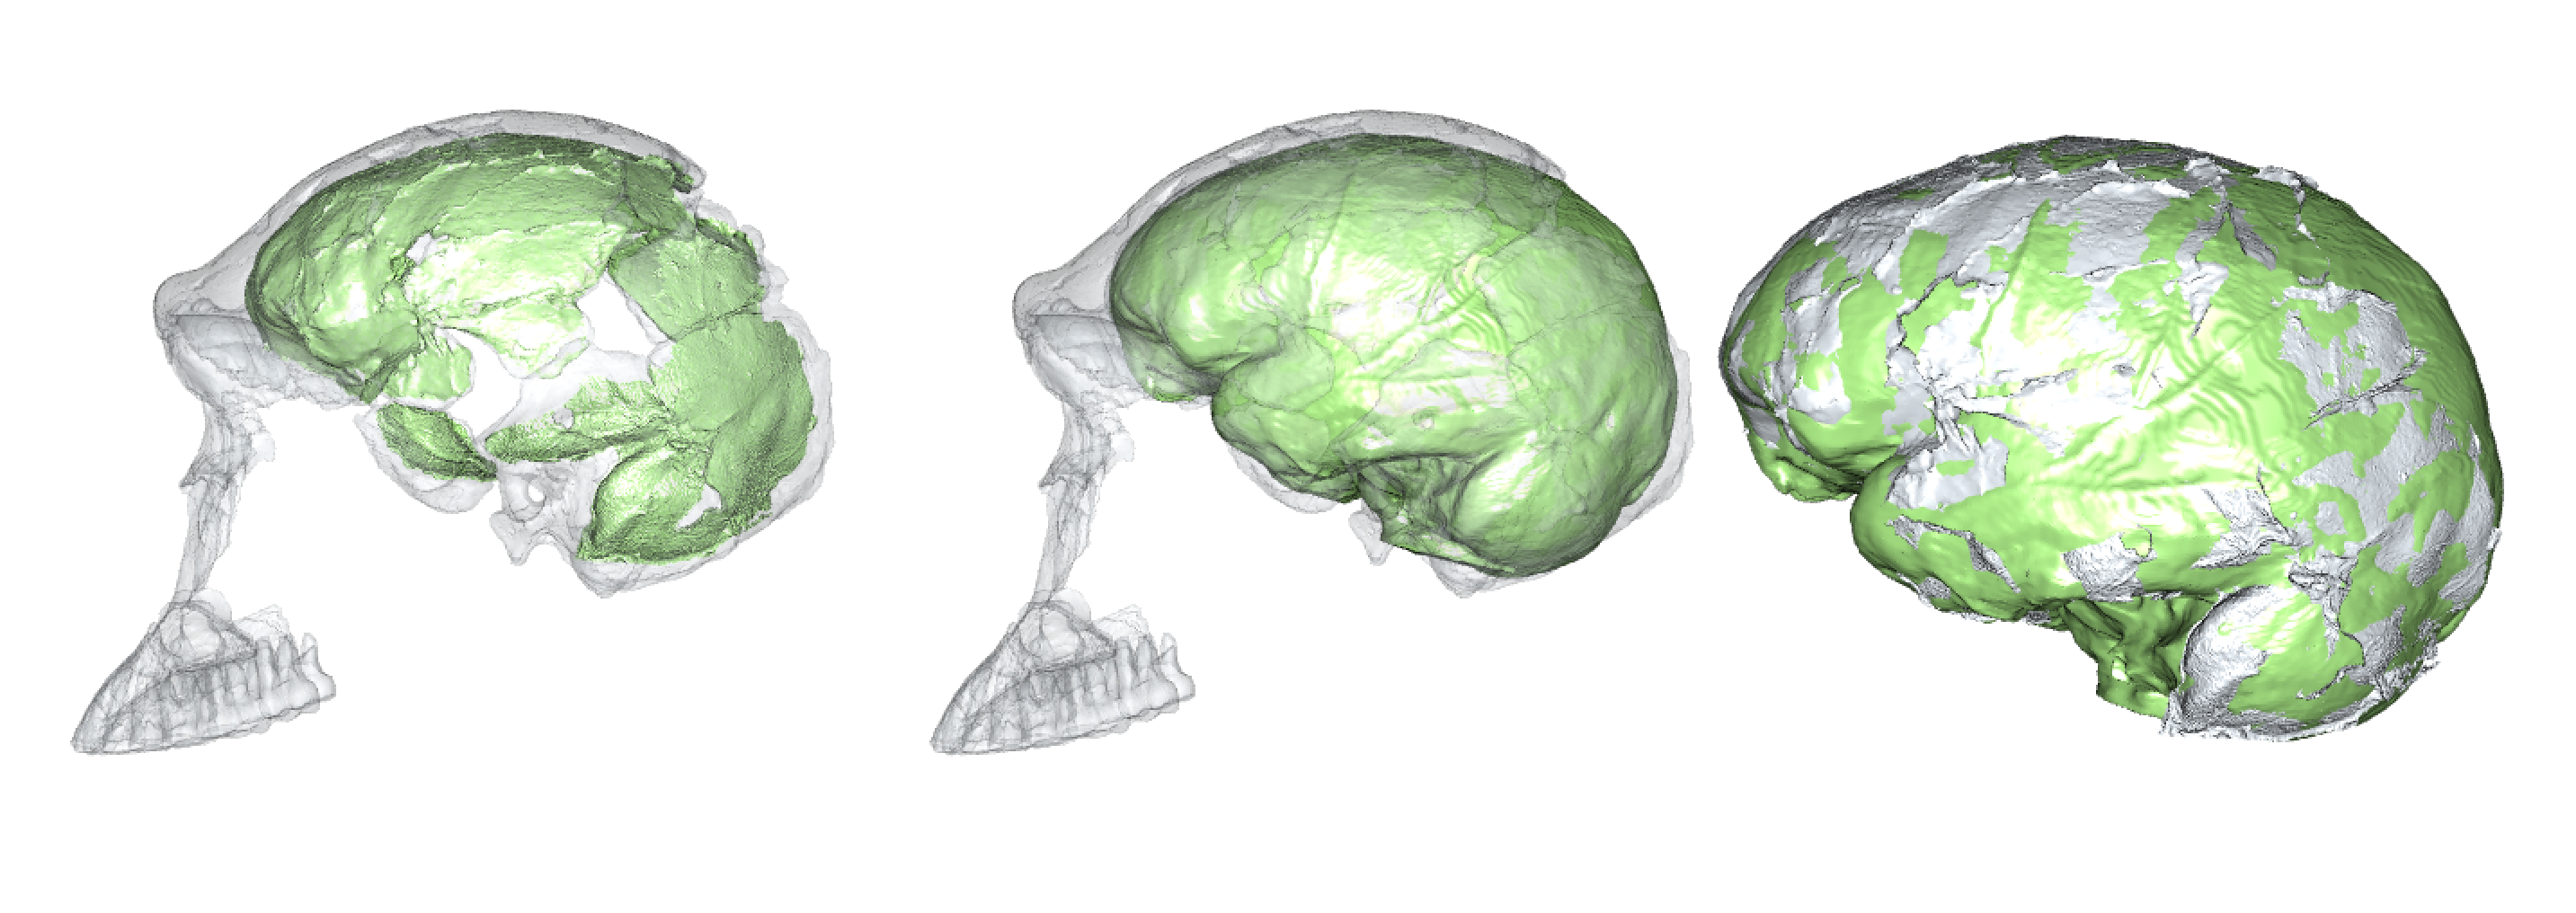
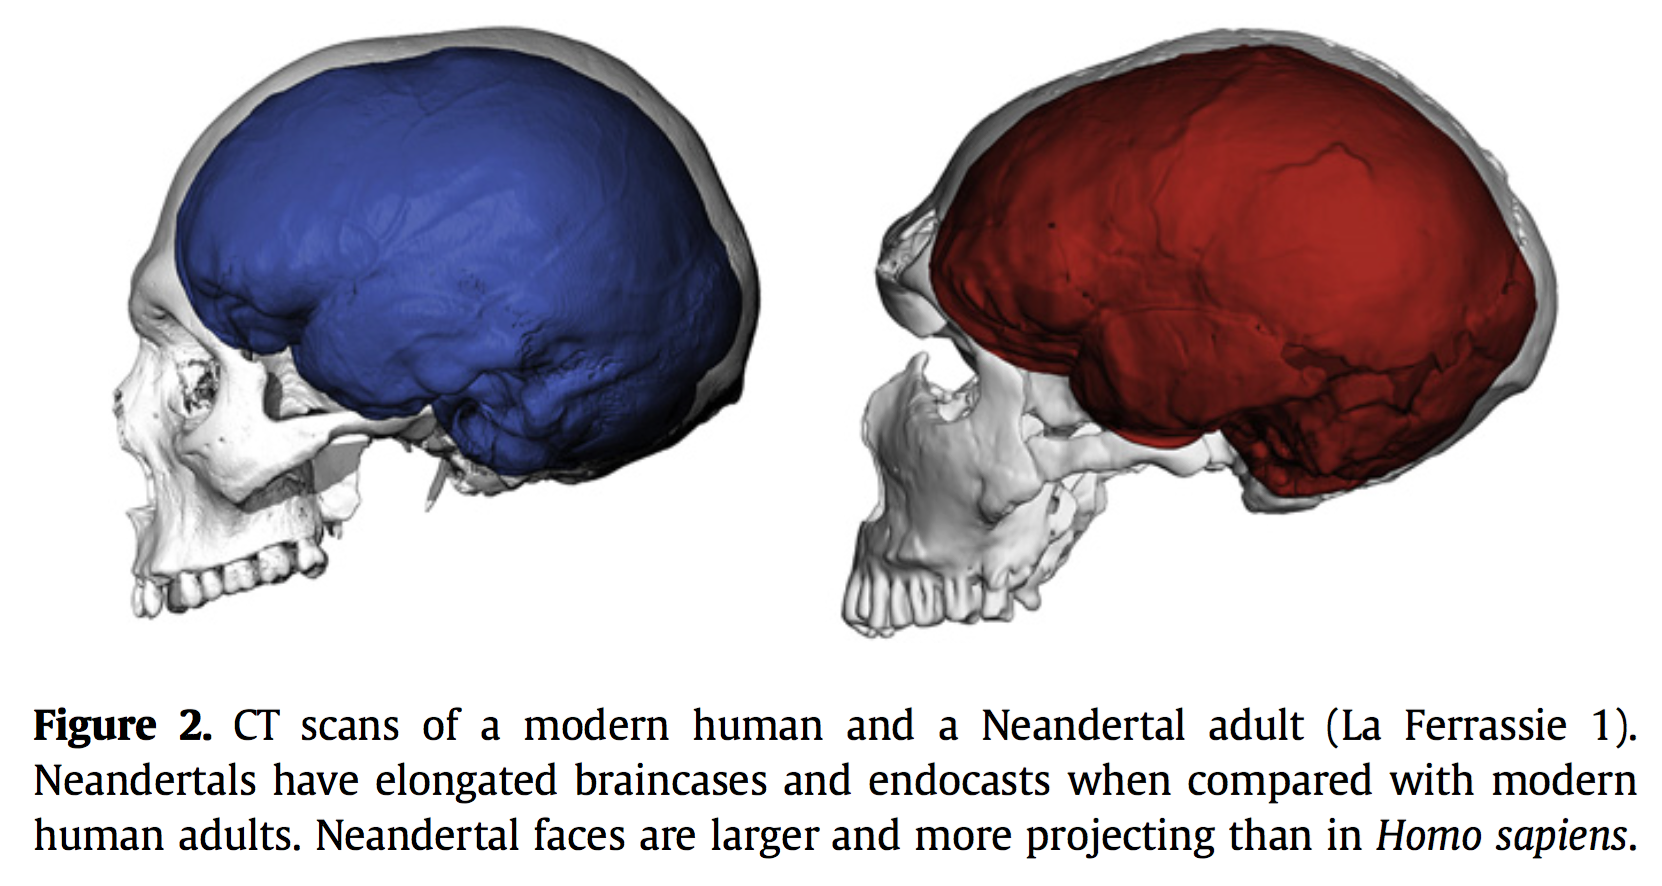
According to Marcia Ponce de Leon and colleagues, “Brain development is similar in Neandertals and modern humans.” They reached this conclusion after comparing how the shape of the brain case changes across the growth period of humans and Neandertals. This finding differs from earlier studies of Neandertal brain shape growth (Gunz et al. 2010, 2012).
Although Neandertals had similar adult brain sizes as humans do today, the brains are nevertheless slightly different in shape:
Endocranial surfaces of a human (left, blue) and Neandertal (right, red), from Gunz et al. (2012). These surfaces reflect the size and shape of the brain, blood vessels, cerebrospinal fluid, and meninges.
Gunz et al. (2010, 2012) previously showed that endocranial development in humans, but not in Neandertals or chimpanzees, has a “globularization phase” shortly after birth: the endocranial surface becomes overall rounder, largely as a result of the expansion of the cerebellum:
Endocranial (e.g., brain) shape change in humans (blue), Neandertals (red) and chimpanzees (green), Fig. 7 from Gunz et al. (2012). Age groups are indicated by numbers. The human “globularization phase” is represented by the great difference in the y-axis values of groups 1-2 (infants). The Neandertals match the chimpanzee pattern of shape change; Neandertal neonates (LeM2 and M) do not plot as predicted by a human pattern of growth.
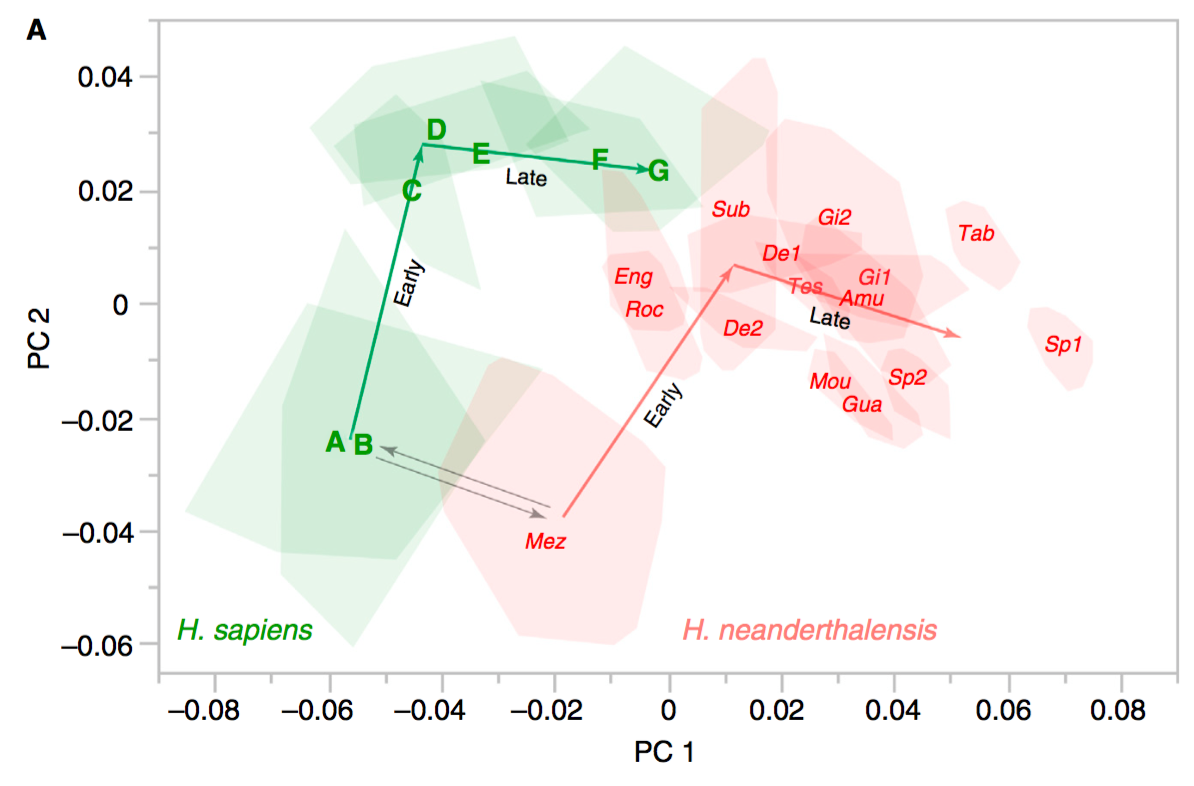
Ponce de Leon and colleagues now challenge this result with their own similar analysis, suggesting similar patterns of shape change with Neandertals experiencing this globularization phase as well (note that endocranial shapes are always different, nevertheless):
Endocranial shape change in humans (green) and Neandertals (red), from Ponce de Leon et al. (2016). Note that the human polygons and letters represent age groups, whereas the Neandertal polygons and labels are reconstructions of individual specimens.
The biggest reason for the difference between studies is in the fossil sample. Ponce de Leon et al. have a larger fossil sample, with more non-adults including Dederiyeh 1-2, young infants in the age group where human brains become more globular.
Comparison of fossil samples between the two studies.
But I don’t think this alone accounts for the different findings of the two studies. Overall shape development is depicted in PC 1: in general, older individuals have higher PC1 scores. The globularization detected by Gunz et al. (2010; 2012) is manifest in PC2; the youngest groups overlap entirely on PC1. The biggest difference I see between these studies is where Mezmaiskaya, a neonate, falls on PC2. In the top plot (Gunz et al., 2012), both Mezmaiskaya and the Le Moustier 2 newborn have similar PC2 values as older Neandertals. In the bottom plot (Ponce de Leon et al., 2012), the Mezmaiskaya neonate has lower PC2 scores than the other Neandertals. Note also the great variability in Mezmaiskaya reconstructions of Ponce de Leon et al. compared with Gunz et al.; some of the reconstructions have high PC2 values which would greatly diminish the similarity between samples. It’s also a bit odd that Engis and Roc de Marsal appear “younger” (i.e., lower PC1 score) than the Dederiyeh infants that are actually a little bit older.
Ponce de Leon et al. acknowledge the probable influence of fossil reconstruction methods, and consider other reasons for their novel findings, in the supplementary material. Nevertheless, a great follow-up to this, to settle the issue of Neandertal brain development once and for all, would be for these two research teams to join forces, combining their samples and comparing their reconstructions.
REFERENCES
Gunz P, Neubauer S, Maureille B, & Hublin JJ (2010). Brain development after birth differs between Neanderthals and modern humans. Current Biology : 20 (21) PMID: 21056830
Gunz P, Neubauer S, Golovanova L, Doronichev V, Maureille B, & Hublin JJ (2012). A uniquely modern human pattern of endocranial development. Insights from a new cranial reconstruction of the Neandertal newborn from Mezmaiskaya. Journal of Human Evolution, 62 (2), 300-13 PMID: 22221766
Ponce de León, M., Bienvenu, T., Akazawa, T., & Zollikofer, C. (2016). Brain development is similar in Neanderthals and modern humans Current Biology, 26 (14) DOI: 10.1016/j.cub.2016.06.022
A few weeks ago we examined sexual dimorphism – characteristic differences between males and females – in my Intro to Bioanthro class. Sexual dimorphism roughly correlates with aspects of social behavior in animals, and so we compared dimorphism in our class with what is seen in other primates. For the lab, we collected our body masses, heights, and lengths of our 2nd and 4th fingers, then I plotted the data and we went over it together.
When collecting data on your students, make sure to get permission from your institution and let students know they can opt out of sharing their personal data. I’ve also assigned students randomized ID numbers to help keep their data private and as anonymous as possible.
This activity builds on the first lab we did this year, measuring our head circumferences to estimate brain size and examining how this varies within the classroom. We saw then that our class’s males have larger brain (well, head) sizes than females. We hypothesized that this was simply due to body size differences – all else being equal, larger people should have larger brains. Now that we collected body mass data, we could test this hypothesis – in fact, when body mass is taken into account, our class’s females have larger brains than males:
Sexual dimorphism in brain size (left), body size (center), and brain size relative to body size (right).
These are sex differences based on raw numbers. Another way to look at dimorphism is to se the extent to which sexes deviate from a scaling relationship (“allometry”). Looking to the left plot below, there is a positive linear relationship between body and brain size: as body size increases, so does brain size. As we saw above, male values are elevated above females’ but there is overlap. Importantly, the right plot shows that deviations from this linear trend, quantified as residuals, are not significantly different for the two sexes. So even though females have large brains relative to their body size in absolute terms, this is not exceptional given how brain size scales with body size.
Brain-body allometry in our classroom. Males and females in our classroom do not seem to deviate appreciably from a common pattern of allometry.
While lab activities help students to understand patterns in data, this lab also shows students the importance of comparing patterns of variation. Students learn from readings and lectures that humans show relatively low levels of dimorphism, and this activity helps them see why we say that. Situating our data within the context of primate dimorphism and mating systems, they can ask if there is an adaptive or evolutionary significance behind our level of dimorphism.
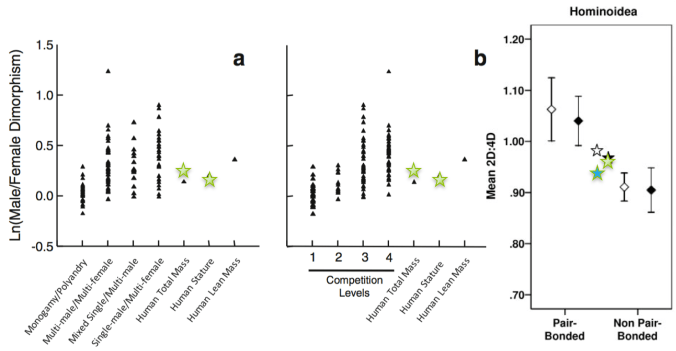
Sexual dimorphism in our classroom compared with what is seen in primates with different mating systems and levels male-male competition. Our class values are the stars, and in the right plot blue is males and green is females. Figures from Plavcan (2012) and Nelson & Schultz (2010).
In this broader comparative context, students tackle what it means for human dimorphism, and ratios of the 2nd digit/4th digit, to be intermediate between what we see in monogamous vs. non-monogamous primates. This can lead some interesting class discussion.
References Nelson E, & Shultz S (2010). Finger length ratios (2D:4D) in anthropoids implicate reduced prenatal androgens in social bonding. American Journal of Physical Anthropology, 141 (3), 395-405. PMID: 19862809
Plavcan JM (2012). Sexual size dimorphism, canine dimorphism, and male-male competition in primates: where do humans fit in? Human Nature, 23 (1), 45-67. PMID: 22388772
The American Association of Physical Anthropologists is holding its annual meeting next year in St. Louis, in my home state of Missouri (I’m from Kansas City, which is by far the best city in the state, if not the entirety of the Midwest). I’ll be giving a talk comparing brain size growth in captive and wild chimpanzees, on Saturday 28 March in the Primate Life History session. Here’s a sneak peak:
Velocity curves for brain size growth from birth to 5 years in wild (green) and captive (blue) chimpanzees. The wild data are endocranial volumes, but the captive specimens are represented by brain masses. So the captive data are modeled for both the original masses (dashed) and estimated volumes (solid). Wild data are from Neubauer et al. 2011, captive data from Herndon et al., 1999.
Abstract: This study compares postnatal brain size change in two important chimpanzee samples: brain masses of captive apes at the Yerkes National Primate Research Center, and endocranial volumes (ECVs) of wild-collected individuals from the Taï Forest. Importantly, age at death is known for every individual, so these cross-sectional samples allow inferences of patterns and rates of brain growth in these populations. Previous studies have revealed differences in growth and health between wild and captive animals, but such habitat effects have yet to be investigated for brain growth. It has also been hypothesized that brain mass and endocranial volume follow different growth curves. To address these issues, I compare the Yerkes brain mass data (n=70) with the Taï ECVs (n=30), modeling both size and velocity change over time with polynomial regression. Yerkes masses overlap with Taï volumes at all ages, though values for the former tend to be slightly elevated over the latter. Velocity curves indicate that growth decelerates more rapidly for mass than ECV. Both velocity curves come to encompass zero between three and four years of age, with Yerkes mass slightly preceding Taï ECV. Thus, Yerkes brain masses and Taï ECVs show a very similar pattern of size change, but there are minor differences indicating at least a small effect of differences in habitat, unit of measurement, or a combination of both. The overall similarity between datasets, however, points to the canalization of brain growth in Pan troglodytes.
I’m reading up on life history in Homo erectus for a few projects I’m working on, and something’s just caught my eye. A 2012 issue of Current Anthropology presents a series of papers from the 2011 symposium, “Human Biology and the Origins of Homo.” This issue is full of great stuff, and to top it all off, it can be accessed online for free! (here’s the JSTOR link)
Gary Schwartz has a paper here recounting what is known (or as he stresses, what is still largely unknown) about growth and life history in early Homo. Dental evidence accumulated over the past 30 years has pointed to a rapid (ape-like) life cycle for fossil hominins, in comparison with a slow, long and drawn out human pattern. But much of the evidence against a human-like pattern is somewhat indirect. For instance, Holly Smith (1991) has shown that there’s a pretty tight relationship between brain size and age at first molar (M1) eruption in Primates:
Fig. 1 from Schwartz (2012). “Bivariate plot of ln M1 emergence age in months (y) versus ln cranial capacity in cubic centimeters (x) for a sample of anthropoids.” The hominins and humans are the open shapes, to which I’ve visually fitted the red line.
It’s a very high correlation (r=0.98). This means that armed with simply an animal’s brain size (“cranial capacity” in the graph), which is fairly easy to estimate given complete enough fossils, one can estimate with a bit of confidence its likely age range for M1 emergence. With brain sizes between apes’ and ours, fossil hominins can be estimated to have erupted their M1s at younger ages than us. Many subsequent studies of tooth formation, based on the microscopic remnants of tooth development, have supported these inferences. So presumably, faster, ape-like dental development could be extrapolated to mean ape-like body growth rates and other aspects of life history as well.
But although this is a tight relationship, there are deviations. As Schwartz notes in the article, and others have noted before, high correlations found when examining large interspecific groups (e.g., primates as a whole) often break down when the focus is on smaller groups of more closely related species (e.g., just apes). Based on the relationship figured above, humans are expected to erupt M1 around 7 years of age, but nearly all humans erupt M1 closer to 6 years (hence the open diamond for humans is below the regression line). What hominins appear to share in common with humans is a younger age at M1 eruption than expected for primates of their brain sizes (the red line I’ve added to the figure).
Hominins’ faster dental development and eruption may be ape-like in absolute terms, but eruption ages may be human-like when their brain size is taken to account. As with many life history variables, the significance of this similarity (if anything) is difficult to ascertain.
The 5th skull early Homo skull from the site of Dmanisi was announced last week. The skull was discovered nearly 10 years ago, but is finally (and very comprehensively) published in Science (Lordkipanidze et al. 2013). The ‘new’ D4500 cranium goes with the massive D2600 mandible, making this the earliest and most complete skull of Homo that I know of. It’s really a remarkable specimen, for a number of reasons beyond its age and completeness. I’ve been busy traveling, teaching and writing lately, so I haven’t yet gotten to pore over the details as much as I’d like. So I hope to sporadically post thoughts on this badass new skull as they come to me. In the mean time, several of what I’d consider the top biology/anthropology blogs*** have discussed the skull, so do check those out if you haven’t already.
The first thing I noted about D4500 is its small brain size, estimated at a mere 546 cubic centimeters. For perspective, D4500 is the green point in the following plot showing brain size in early human evolution:
Endocranial volume for various fossil hominin fossils. 1: Australopithecus afarensis, africanus & boisei; 2: Dmanisi specimens; 3: “habilines” 4: early African Homo erectus; 5: Indonesian and Chinese Homo erectus. D4500 is green with envy.
I got to see (but not study) the cranium a few years ago when I was helping with the Dmanisi Paleoanthropology field school, and I remember noting just how “robust” the specimen was – big mastoid processes, prominent and thick brow ridge, huge attachments for the neck muscles. In humans, and presumably our fossil forebears, these features are more developed in males than females, and so presumably D4500 was a male (consistent with the huge, associated D2600 mandible). In many primates, and 4 to ~1 mya hominins so far as we can tell, males are larger than females. So it is surprising that a robust probable male cranium is in fact not only the smallest in the Dmanisi sample, but also at the low end of early African Homo (i.e. habilis or rudolfensis), comparable to the largest australopiths. Of course, the only other faces known from Dmanisi are either not fully grown (D2700 and D2282) or old and decrepit (D3444), so perhaps the larger-brained specimens would have been at least as robust as D4500. An untestable hypothesis!
The new skull really highlights the overlap, or continuous variation between later australopiths and early Homo known also from eastern Africa. In association with the postcranial remains known from Dmanisi, the authors the paper posit that early Homo may have been distinguished from Australopithecus not so much in brain size as in body size. We could probably add body shape (limb proportions) and tool use to that list of distinguishing features, and to be sure there are Oldowan tools and small but human-like body size and shape indicated by postcrania at Dmanisi. But then, evidence for body proportions and for/against tool use in Australopithecus, especially later in the record, is somewhat equivocal…
Reference: David Lordkipanidze, Marcia S. Ponce de León, Ann Margvelashvili, Yoel Rak, G. Philip Rightmire, Abesalom Vekua, and Christoph P. E. Zollikofer. 2013. A Complete Skull from Dmanisi, Georgia, and the Evolutionary Biology of Early Homo. Science: 342 (6156), 326-331.