We’ve just done the first lab activity in my Human Evo Devo course. My current university is young, and so we haven’t yet acquired good skeletal materials for teaching. Fortunately, the good people at Kyoto University’s Primate Research Institute have made a large, open access database of primate CT scans. For this first lab, students compare skeletons of neonate and adult chimpanzees, getting a crash-course in osteology, CT data, growth-related changes, and chimps.
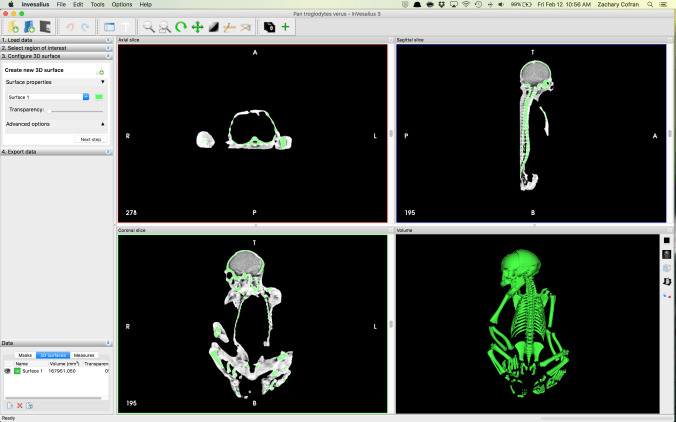
Neonatal chimpanzee. Three windows give 2D slices in anatomical planes, while the 4th window contains the reconstructed 3D volume that can be rotated and analyzed.
The activity requires a computer lab with the freeware CT analysis program InVesalius. CT files (dicom stacks) can be downloaded from the KUPRI database, but they are massive (100s of MBs), so I recommend some preprocessing before starting the class. I downloaded the specimens we were to use, opened each one in InVesalius, and saved as an .inv3 file. These are on the order of 50-80 Mb each. With smaller, prepared files, it’s faster and easier for students to download and start using them. While the neonate skeleton was small enough to fit into a single dicom stack, the adult scans were so large that I had to use separate files for the the skull, scapula, pelvis, and limbs (pre-separated on the KUPRI database).
Students examined one neonate and adult, making qualitative observations and taking a few cranial and postcranial measurements on each individual.
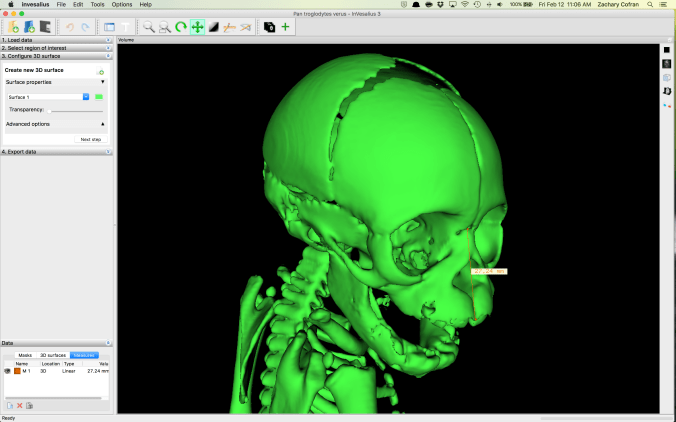
It’s pretty easy to take linear and angular measurements on both the 3D volume and the 2D slices in InVesalius.
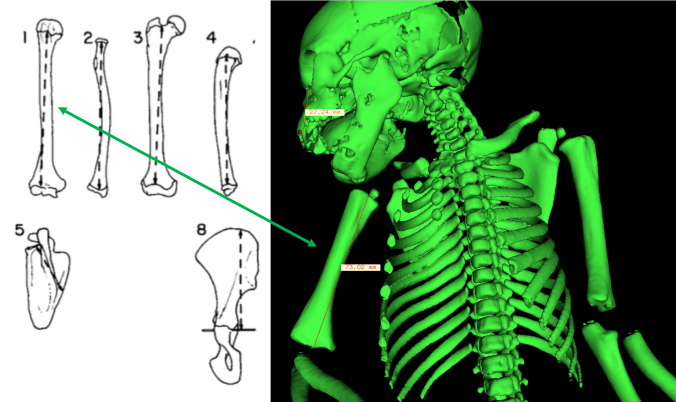
One goal of the assignment is to show students how bones change with growth, in terms of both gross anatomy and overall size. By measuring the diaphyseal lengths, they see what limb bones look like with and without epiphyses.
Measuring diaphyseal, rather than maximum, lengths. Left figure from Jungers and Susman (1984).
Students examine how much size change occurs between birth and adulthood in chimpanzees. They then compare these skeletal sizes and proportional changes with comparable human data (well, up to age 12), taken from Scheuer and Black (2000). This will help get them started thinking about how postnatal growth might lead to differences between adults of each species, or how developmental modifications effect evolutionary changes.
Scheuer L and Black L. 2000. Developmental Juvenile Osteology. Academic Press.
Jungers WL and Susman RL. (1984). Body size and skeletal allometry in African Apes. The Pygmy Chimpanzee: Evolutionary Biology and Behavior, 131-177 DOI: 10.1007/978-1-4757-0082-4_7
Try as I might, I can never escape osteology. Never. Just the other day, I was walking through my school’s expansive, boneless atrium, when these haphazardly scattered letters stopped me in my tracks:
DЯSTUDENSN
Amidst this alphabet soup, there it was, calling out to me. Whispering. Longing….
Ah, the dens. What is the “dens” you ask? It is a special little projection on a special little bone, the second cervical vertebra (C2). Why is it special? Well, most vertebrae look pretty similar to one another, with a body in the front being held in awkward embrace by a bony neural arch in the back.
But not the first two vertebrae, C1 and C2. No, these rebels are spinal celebrities. C1, whose rock name is “Atlas” (presumably in honor of its favorite episode of Wishbone) cradles the skull’s occipital condyles on its concave shoulders. Lacking a true body or centrum, Atlas viewed from the top resembles the gaping maw of a manta ray:
Top: Manta ray. Bottom: Atlas viewed from top, anterior is on the bottom (from Scheuer and Black, 2000). A and F refer to the age at which the bony portions appear and fuse, respectively.
Atlas is a jerk and so it sits right on top of C2, whose rock name is Axis (after the second album by the Jimi Hendrix Experience). More gawky and angsty than Atlas, Axis differs from the rest of the vertebrae in having an extension, the dens, which reaches skyward to boop the inside of Atlas’ maw:
Top: Axis viewed from the front. Bottom: Axis getting pwnd by Atlas. Modified from White et al. (2012).
The most distinctive feature of Axis, aside from its smoldering adolescent rage, is the dens (or odontoid process). If you find a bone fragment that is verily vertebral and has a perpendicular projection, you can bet good tenge you’ve got an Axis. Even a densless fragment can be distinguished from all other vertebrae by its superior articular facets, which are rather flat and face mostly superiorly.
What I thought would be a casual jaunt after class last week turned out to be a horrific reminder of the most amazing vertebrae. This must be how Scott Williams always feels.
This term I’m teaching two of my favorite classes, and I’ve updated their syllabi on my Teaching page. First is a 200-level class about human biological variation and issues surrounding race. Second is my baby, a 300-level on human evolutionary developmental biology. If you want to teach these kinds of classes but don’t want to reinvent the wheel, feel free to use these syllabi to develop your own!
Here are the course descriptions:
Ant 263: Humans and Race
This course examines the nature of human biological variation, in the contexts of genetics, anatomy, history, and society. Students will learn about why humans vary, what this variation does and does not tell us about people, and the ways in which social inequality becomes manifest in human biology. The course will begin by surveying biological variation, both adaptive and selectively neutral, in humans. We will then focus on what the term ‘race’ means biologically, and why this concept does not describe human variation. Moving from biology and genetics, we examine psychological and historical origins of racialist thinking in the United States. This historical overview segues into an analysis of how racial categories are used in biomedical research today. Through the framework of the developmental origins of health and disease, we review the biological mechanisms whereby social inequality results in health disparity.
Ant 364: Human Evolutionary Developmental Biology
What literally makes us human? This class will examine how growth and development were modified over the course of human evolution, to create the animals that we are today. Human anatomy is placed in an evolutionary context by comparison with living primates and the human fossil record. The first half of the course focuses on theory, namely evolution, genetics and life history. The second half examines evidence for the development and evolution of specific parts of the body, from head to toe.
These headlines, each saying something slightly different, are referring to a study by Indjeian and colleagues published in Cell. Researchers identified a stretch of DNA that is highly conserved across mammals, or in other words, it is very similar between very different organisms. In humans, however, this conserved region is actually missing (“hCONDEL.306”):
Fig. 4A from Indjeian et al. 2016. A stretch of DNA on Chromosome 8, “hCONDEL.306,” is very similar between chimpanzees, macaque monkeys, and mice, but is completely missing in humans (as is another stretch, hCONDEL.305).
That a stretch of DNA should be highly conserved across diverse animal groups suggests purifying natural selection has prevented any mutations from occurring here – alterations to this stretch of DNA negatively affected fitness. But that humans should be missing such a highly conserved region suggests that this deletion came under positive natural selection at some point in human evolution. This strategy, of seeking stretches of DNA that are similar between many animals but very different in humans, has led to the identification of hundreds of genetic underpinnings of human uniqueness. Some of these, such as the case in question, involve deleted sequences and have been termed “hCONDELs,” for “regions with high sequence conservation that are surprisingly deleted in humans” (McLean et al., 2011: 216). Others involve the accumulation of mutations where other animals show few or none (e.g., HACNS1; Prabhakar et al. 2008). In many (most?) cases these are “non-coding” sequences of DNA.
How can “non-coding” DNA help make humans upright?
As was predicted 30 years ago (King and Wilson, 1975), what makes humans different from other animals isn’t so much in the protein-coding DNA (the classical understanding of the term, “genes”), but rather in the control of these protein-coding genes. “Non-coding” means that a stretch of DNA may get transcribed into RNA but is not then translated into proteins. But even though these sequences themselves don’t become anything tangible, many are nevertheless critical in regulating gene expression – when, where and how much a gene gets used. It’s wild stuff. Indeed, “Many human accelerated regions are developmental [gene] enhancers” (Capra et al., 2013).
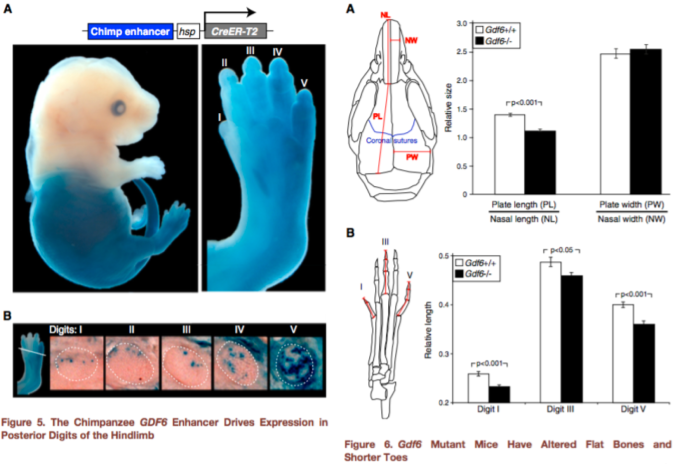
In the present case, hCONDEL.306 refers to the human-specific deletion of a developmental enhancer located near the GDF6 gene, which is a bone morphogenetic protein. The major finding of the paper, as stated succinctly in the Highlights title page, is that “Humans have lost a conserved regulatory element [hCONDEL.306] controlling GDF6 expression…. Mouse phenotypes suggest that [this] deletion is related to digit shortening in human feet.”
How do they link this “gene tweak” to digit shortening?
Since humans have lost this gene enhancer that is highly conserved in other mammals, Indjeian and team reasoned that the chimpanzee DNA sequence associated with this deletion, retaining the enhancer sequence, is likely the ancestral condition from which the human version evolved. They inserted the chimpanzee version into mouse embryos and watched what happened as they developed. The enhancer was only active in the mice’s back legs, specifically in the cartilage that would later become the lateral toe bones and cells that would become a muscle of the big toe (abductor hallucis). These are areas where humans and chimpanzees differ: our lateral toes are shorter than chimps’, and we only have one abductor hallucis muscle whereas chimpanzees have an additional, longer abductor hallucis (Aiello and Dean, 2002). So, we’re on our way to seeing how hCONDEL.306 might relate to our big toe or upright walking, as the headlines say.
But this still doesn’t explain how this deletion affects GDF6 gene expression, and therefore what this does for our feet. Pressing onward, the scientists compared the size of certain bones in mice with a normal Gdf6 gene, and those in which the Gdf6 gene was completely turned off (or “knocked out”). The Gdf6 knock-out mice had shorter lateral toe bones than regular mice, but they also had shorter big toes as well – the previous experiment staining mouse embryos showed the ancestral enhancer was expressed more in the latter toes, not so much the big toe.
Figures 5-6 from Indjeian et al. (2016) sum up the findings. Figure 5 (left) shows that the ancestral version of the GDF6 enhancer (blue staining) is most strongly expressed in the lower half of the body, especially the fifth toe bone. Figure 6 (right) shows that a lack of Gdf6 expression (black bars) results in shorter skull and toe bones. Combining these findings, humans lack a gene enhancer associated with the development of long lateral toes.
hCONDEL.306 doesn’t completely turn off GDF6, so this second experiment doesn’t really tell us exactly what the hCONDEL does. But the results are highly suggestive. Indjeian and team showed that Gdf6 affects toe length, among other skeletal traits, in mice. The ancestral enhancer that humans are missing seems to affect GDF6 activity in the leg/foot only. This illustrates a mechanism of modularity – as the authors state, “Loss of this enhancer would thus preserve normal GDF6 functions in the skull and forelimbs, while confining any … changes to the posterior digits of the hindlimb.” In other words, developmental enhancers allow different parts of the body to evolve independently despite being made by some of the same genes (such as GDF6).
As with any good study, results are intriguing but they raise more questions for future studies. The researchers conducted two experiments to investigate the function of hCONDEL.306: first putting the chimp version in mouse embryos to see where the ancestral enhancer is expressed, and then turning off Gdf6 completely in mice to see what happens. A more direct way to see what hCONDEL.306 does might be to put a longer stretch of the human sequence surrounding GDF6 containing (or rather missing) the ancestral enhancer into mouse embryos. I’m not a molecular biologist so maybe this isn’t possible. But this is important because the ancestral (chimpanzee) enhancer appeared to be most strongly expressed in the little toe, but of course this isn’t our only toe that is short compared to chimps. Similarly, how hCONDEL.306 relates to the abductor hallucis muscle remains in question – does it reduce the size of the intrinsic muscle present in both humans and chimps, or does it prevent development of the longer muscle that chimps have but we lack? We can expect to find hCONDEL.306 in the genomes of Neandertals (and Denisovans?), since they also have short toes, but what would it mean if they retained the ancestral enhancer?
So how does this gene tweak help with upright walking?
This is a really cool paper with important implications for human evolution, but something seems to have been lost in translation between the paper and the headlines (the news pieces themselves are good, though). The upshot of the study is that humans lack a stretch of non-coding DNA, which in chimpanzees (or chimp-ified mice) promotes embryonic development of the lateral toes and a big toe muscle. This may be a genetic basis for at least some aspects of our unique feet that have evolved under natural selection for walking on two legs.
But the headlines misrepresent this result, with words like “led to,” “allowed,” and “caused,” especially when these are followed by “big toe” or “upright walking.” hCONDEL.306 doesn’t really have anything to the big toe bone itself, although it might relate to a muscle affecting our big toe. The only sense in which the “Gene tweak led to humans’ big toe” (first title above) is that hCONDEL.306 might be responsible for our short lateral toes, which make our first toe look big by comparison. The other headlines are misleading since we know from fossil evidence that hominins walked upright long before we have evidence for short toes:
These little piggies get none. Fourth toe bones of living apes and humans (left) and (probable) hominins from 3-5 million years ago (right). I did my best to get all images to scale.
“Epigenetic,” from the fourth article headline, is simply wrong. Modern day epigenetics is a field concerned with the chemical alterations to the structure of DNA. Even the broad concept of epigenetic as originally devised by Conrad Waddington was about how environments (cellular or outside the body) influence development.
It’s hard to fit all the important and interesting information from scientific papers into news headlines. Still, it would be good if headlines more accurately portrayed scientific findings, especially avoiding such definitive verbs as “caused.” Especially in the realm of biology, people should know that there’s a lot that we still don’t know, that there’s lots more important work left to be done.
References
Aiello and Dean, 2002. Human Evolutionary Anatomy. Academic Press.
Capra et al., 2013. Many human accelerated regions are developmental enhancers. Philosophical Transactions of the Royal Society B 368: 20130025.
Indjeian et al. 2016. Evolving new skeletal traits by cis-regulatory changes in bone morphogenetic proteins. Cell http://dx.doi.org/10.1016/j.cell.2015.12.007
King and Wilson, 1975. Evolution at two levels in humans and chimpanzees. Science 188: 107-116 DOI: 10.1126/science.1090005
McLean et al., 2011. Human-specific loss of regulatory DNA and the evolution of human-specific traits. Nature 471: 216-219.
Prabhakar et al., 2008. Human-specific gain of function in a developmental enhancer. Science 321: 1346-1350.
Holy crap 2015 was a big year for fossils. And how fortuitous that 2016 begins on a Fossil Friday – let’s recap some of last year’s major discoveries.
Homo naledi
Some Homo naledi mandibles in order from least to most worn teeth.
The Homo naledi sample is a paleoanthropologist’s dream – a new member of the genus Homo with a unique combination of traits, countless remains belonging to at leasta dozen individuals from infant to old adult, representation of pretty much the entire skeleton, and a remarkable geological context indicative of intentional disposal of the dead (but certainly not homicide, grumble grumble grumble…). The end of 2015 saw the announcement and uproar (often quite sexist) over this amazing sample. You can expect to see more, positive things about this amazing animal in 2016.
We’ll be presenting a bunch about Homo naledi at this year’s AAPA meeting in Hotlanta. I for one will be discussing dental development at Dinaledi- here’s a teaser:
As long as we’re talking about the AAPA meetings, my colleague David Pappano and I are organizing a workshop, “Using the R Programming Language for Biological Anthropology.” Details to come!
Lemur graveyard
Homo naledi wasn’t the only miraculously copious primate sample announced in 2015. Early last year scientists also reported the discovery of an “Enormous underwater fossil graveyard,” containing fairly complete remains of probably hundreds of extinct lemurs and other animals. As with Homo naledi, such a large sample will reveal lots of critical information about the biology of these extinct species.
Australopithecus deyiremeda
Extended Figure 1h from Haile-Selassie et al. (2015), compared with Demirjian developmental stages 6-8 . While the M1 roots look like stage 8 (complete), M2 looks like stage 7 (incomplete).
We also got a new species of australopithecus last year. Australopithecus deyiremeda had fat mandibles, a relatively short face (possibly…), and smaller teeth than in contemporaneous A. afarensis. One tantalizing thing about this discovery is that we may finally be able to put a face to the mysterious foot from Burtele, since these fossils come from nearby sites of about the same geological age. Also intriguing is the possible evidence, based on published CT images (above), that A. deyiremeda had relatively advanced canine and delayed molar development, a pattern generally attributed to Homo and not other australopithecines (if this turns out to be the case, you heard it here first!).
Lomekwian stone tool industry
3D scan and geographical location of Lomekwian tools. From africanfossils.org.
Roughly contemporaneous with A. deyiremeda, Harmand et al. (2015) report the earliest known stone tools from the 3.3 million year old site of Lomekwi 3 in Kenya. These tools are a bit cruder and much older than the erstwhile oldest tools, the Oldowan from 2.6 million years ago. These Lomekwian tools, and possible evidence for animal butchery at the 3.4 million year old Dikika site in Ethiopia (McPherron et al. 2010; Thompson et al. 2015), point to an earlier origin of lithic technology. Fossils attributed to Kenyanthropus platyops are also found at other sites at Lomekwi. With hints at hominin diversity but no direct associations between fossils and tools at this time, a lingering question is who exactly was making and using the first stone tools.
Earliest Homo
The reconstructed Ledi Geraru mandible (top left), compared with Homo naledi (top right), A. deyiremeda (bottom left), and the Uraha early Homo mandible from Malawi (bottom right). Jaws are scaled to roughly the same length from the front to back teeth; the Uraha mandible does not have an erupted third molar whereas the others do and are fully adult.
Just as Sonia Harmand and colleagues pushed back the origins of technology, Brian Villmoare et al. pushed back the origins of the genus Homo, with a 2.7 million year old mandible from Ledi Geraru in Ethiopia. This fossil is only a few hundred thousand years younger than Australopithecus afarensis fossils from the nearby site of Hadar. But the overall anatomy of the Ledi Geraru jaw is quite distinct from A. afarensis, and is much more similar to later Homo fossils (see image above). Hopefully 2016 will reveal other parts of the skeleton of whatever species this jaw belongs to, which will be critical in helping explain how and why our ancestors diverged from the australopithecines. (note that we don’t yet have a date for Homo naledi – maybe these will turn out to be older?)
Early and later Homo
Left: modified figures 2-3 from Maddux et al. (2015). Right: modified figures 7 & 13 from Ward et al. (2015). Note that in the right plot, ER 5881 femur head diameter is smaller than all other Homo except BSN 49/P27.
The earlier hominin fossil record wasn’t the only part to be shaken up. A small molar (KNM-ER 51261) and a set of associated hip bones (KNM-ER 5881) extended the lower range of size variation in Middle and Early (respectively) Pleistocene Homo. It remains to be seen whether this is due to intraspecific variation, for example sex differences, or taxonomic diversity; my money would be on the former.
Left: Penghu 1 hemi-mandible (Chang et al. 2015: Fig. 3), viewed from the outside (top) and inside (bottom). Right: Manot 1 partial cranium (Hershkovitz et al. 2015: Fig. 2), viewed from the left (top) and back (bottom).
At the later end of the fossil human spectrum, researchers also announced an archaic looking mandible dredged up from the Taiwan Straits, and a more modern-looking brain case from Israel. The Penghu 1 mandible is likely under 200,000 years old, and suggests a late survival of archaic-looking humans in East Asia. Maybe this is a fossil Denisovan, who knows? What other human fossils are waiting to be discovered from murky depths?
The Manot 1 calvaria looks very similar to Upper Paleolithic European remains, but is about 20,000 years older. At the ESHE meetings, Israel Hershkovitz actually said the brain case compares well with the Shanidar Neandertals. So wait, is it modern or archaic? As is usually the case, with more fossils come more questions.
Crazy dinosaurs
Yi qi was bringing Skeksi back, and its upper limb had a wing-like shape not seen in any other dinosaur, bird or pterosaur. There were a number of other interesting non-human fossil announcements in 2015 (see here and here), proving yet again that evolution is far more creative than your favorite monster movie makers.
What a year – new species, new tool industries, new ranges of variation! 2015 was a great year to be a paleoanthropologist, and I’ll bet 2016 has just as much excitement in store.
References (in order of appearance)
Haile-Selassie, Y., Gibert, L., Melillo, S., Ryan, T., Alene, M., Deino, A., Levin, N., Scott, G., & Saylor, B. (2015). New species from Ethiopia further expands Middle Pliocene hominin diversity Nature, 521 (7553), 483-488 DOI: 10.1038/nature14448
Harmand, S., Lewis, J., Feibel, C., Lepre, C., Prat, S., Lenoble, A., Boës, X., Quinn, R., Brenet, M., Arroyo, A., Taylor, N., Clément, S., Daver, G., Brugal, J., Leakey, L., Mortlock, R., Wright, J., Lokorodi, S., Kirwa, C., Kent, D., & Roche, H. (2015). 3.3-million-year-old stone tools from Lomekwi 3, West Turkana, Kenya. Nature, 521 (7552), 310-315. DOI: 10.1038/nature14464
McPherron, S., Alemseged, Z., Marean, C., Wynn, J., Reed, D., Geraads, D., Bobe, R., & Béarat, H. (2010). Evidence for stone-tool-assisted consumption of animal tissues before 3.39 million years ago at Dikika, Ethiopia. Nature, 466 (7308), 857-860. DOI: 10.1038/nature09248
Thompson, J., McPherron, S., Bobe, R., Reed, D., Barr, W., Wynn, J., Marean, C., Geraads, D., & Alemseged, Z. (2015). Taphonomy of fossils from the hominin-bearing deposits at Dikika, Ethiopia Journal of Human Evolution, 86, 112-135 DOI: 10.1016/j.jhevol.2015.06.013
Villmoare, B., Kimbel, W., Seyoum, C., Campisano, C., DiMaggio, E., Rowan, J., Braun, D., Arrowsmith, J., & Reed, K. (2015). Early Homo at 2.8 Ma from Ledi-Geraru, Afar, Ethiopia Science, 347 (6228), 1352-1355 DOI: 10.1126/science.aaa1343
Maddux, S., Ward, C., Brown, F., Plavcan, J., & Manthi, F. (2015). A 750,000 year old hominin molar from the site of Nadung’a, West Turkana, Kenya Journal of Human Evolution, 80, 179-183 DOI: 10.1016/j.jhevol.2014.11.004
Ward, C., Feibel, C., Hammond, A., Leakey, L., Moffett, E., Plavcan, J., Skinner, M., Spoor, F., & Leakey, M. (2015). Associated ilium and femur from Koobi Fora, Kenya, and postcranial diversity in early Homo Journal of Human Evolution, 81, 48-67 DOI: 10.1016/j.jhevol.2015.01.005
Chang, C., Kaifu, Y., Takai, M., Kono, R., Grün, R., Matsu’ura, S., Kinsley, L., & Lin, L. (2015). The first archaic Homo from Taiwan Nature Communications, 6 DOI: 10.1038/ncomms7037
Hershkovitz, I., Marder, O., Ayalon, A., Bar-Matthews, M., Yasur, G., Boaretto, E., Caracuta, V., Alex, B., Frumkin, A., Goder-Goldberger, M., Gunz, P., Holloway, R., Latimer, B., Lavi, R., Matthews, A., Slon, V., Mayer, D., Berna, F., Bar-Oz, G., Yeshurun, R., May, H., Hans, M., Weber, G., & Barzilai, O. (2015). Levantine cranium from Manot Cave (Israel) foreshadows the first European modern humans Nature, 520 (7546), 216-219 DOI: 10.1038/nature14134
Frank Williams and I have a paper coming out shortly, comparing skull growth in Neandertals and humans. We use the resampling-based “grdif” method (see here) to compare an ontogenetic series of 20 non-adult and 20 adult Neandertals with a giant ontogenetic sample of humans. While Neandertal skull growth has been looked at before, the fragmentary nature of the fossil sample has caused most earlier studies to focus either on single traits or relatively few, often reconstructed, non-adult Neandertals. The advantage of grdif is that it incorporates all fossils regardless of their preservation, and provides a statistical comparison of cross-sectional samples.
In general, and unsurprisingly, skull growth is quite similar between humans and Neandertals. They’re closely related groups, after all. Compare grdif statistics, which measure how much two samples differ in growth between age groups, for humans vs. Neandertals (left) and humans vs. Australopithecus robustus (right):
Growth differences (grdif) between humans and Neandertal skulls (left), and human and A. robustus mandibles (right). If two groups undergo the same amount of growth between age groups or stages, grdif equals 0. Positive values mean the fossil group grows more, while negative values mean humans grow more. Left is a figure from the paper, right is from my dissertation.
The Neandertal-human comparison shows much less difference than the australopith-human comparison. In spite of this general similarity between Neandertal and human skull growth, there are some key differences. Many distinct Neandertal traits, such as the extremely broad nasal aperture, appear piecemeal over the course of growth, rather than all at once. Some recent studies using geometric morphometrics have pointed to different patterns of craniofacial growth in Neandertals, but these were limited in needing smaller samples of more complete fossils. While the grdif approach doesn’t have the power to examine complex shape the same way as GM, and doesn’t produce as pretty of pictures, grdif does help fill in the gaps by including even fragmentary fossils. This is important as it helps reveal when during growth anatomical differences between groups appear.
Our paper will be out (hopefully early) in 2016 in American Journal of Physical Anthropology. In the mean time, the basic strategy of grdif is explained in Cofran (2014), and the R code for using this method can be found on my Research page.
Reference Cofran Z (2014). Mandibular development in Australopithecus robustus. American Journal of Physical Anthropology, 154 (3), 436-46 PMID: 24820665
Last week in my Human Evolution class we looked at whether we could estimate hominin brain sizes, or endocranial volumes (ECV), based on just the length and width of the bony brain case. Students took these measurements on 3D surface meshes…
Maximum cranial length in Australopithecus boisei specimen KNM-ER 406.
… and then plugged their data into equations relating these measurements to brain size in chimpanzees (Neubauer et al., 2012) and humans (Coqueugniot and Hublin, 2012).
The relationship between cranial length (x axis) and ECV (y axis). Left shows the chimpanzee regression (modified from Fig. 2 in Neubauer et al., 2012), while the right plot is humans (from the Supplementary Materials of Coqueugniot and Hublin, 2012).
So in addition to spending time with fossils, students also learned about osteometric landmarks with fun names like “glabella” and “opisthocranion.” More importantly, students compared their estimates with published endocranial volumes for these specimens, based on endocast measurements:
Human and chimpanzee regression equations don’t do great at predicting hominin brain sizes. Each point is a hominin fossil, the x value depicting its directly-measured endocranial volume and the y value its estimated volume based on different regression equations. Black and red points are estimates based on chimpanzee cranial width and length, respectively, while green and blue points are based on human width and length, respectively. The dashed line shows y=x, or a correct estimate.
This comparison highlights the point that regression equations might not be appropriate outside of the samples on which they are developed. Here, estimates based on the relationship between cranial dimensions and brain size in chimpanzees tend to underestimate fossils’ actual values (black and red in the plot above), while the human regressions tend to overestimate hominins’ brain sizes. Students must think about why these equations perform poorly on fossil hominins.
Here are the lab materials so you can use and adapt this for your own class:
References Coqueugniot, H., & Hublin, J. (2012). Age-related changes of digital endocranial volume during human ontogeny: Results from an osteological reference collection American Journal of Physical Anthropology, 147 (2), 312-318 DOI: 10.1002/ajpa.21655
Neubauer, S., Gunz, P., Schwarz, U., Hublin, J., & Boesch, C. (2012). Brief communication: Endocranial volumes in an ontogenetic sample of chimpanzees from the taï forest national park, ivory coast American Journal of Physical Anthropology, 147 (2), 319-325 DOI: 10.1002/ajpa.21641
I went to a cafe today to eat breakfast and get some work done. Write, write, write. It’s important to be properly nourished to ensure maximal productivity.
The Ron Swanson diet.
But I was aghast to behold the food they placed before me:
What on earth is this?
First of all, this is not a sufficient amount of bacon.
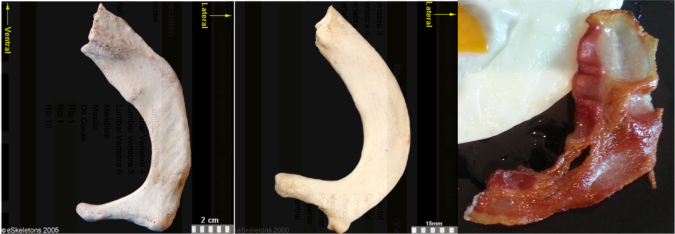
Secondably, this bacon is a spitting image of a first rib:
First ribs from the right side of the body, viewed from the top. From left to right: Human, chimpanzee, bacon. First two images from eSkeletons.org.
At the top of the ribcage, just beneath the clavicle and subclavian artery and vein, the first rib is much shorter and flatter than the rest of the ribs. As Jess Beck at Bone Broke points out, “The first and second rib give something of an awkward ‘slow song at a middle-school dance’ kind of a hug, while the lower ribs provide a more comfortable and self-assured embrace.” I mean, just lookit how sheepishly the bacon dances with the eggs in the first picture, it has ‘middle-school dance’ written all over it.
But the bacon is not totally identical to the human and chimpanzee counterparts. It’s missing their anteromedially sweeping arc, and the distal portion reaching out to the egg is fairly straight. This suggests we’re probably missing much of the original distal end. Posteriorly or dorsally (toward the bottom in the pic), it also appears to be missing much of the lateral portion including the vertebral facet. In this regard, this bacon rib looks a lot like the first rib of Homo naledi:
Full stack of ribs. Left to right: Human, bacon, Homo naledi, Dmanisi Homo erectus, Australopithecus sediba (x2), Australopithecus afarensis specimen “Lucy,” Ardipithecus ramidus, and chimpanzee. Images not to scale except Lucy and Ardi. Image credits given below.
It is hard to make good homologous comparisons among these fossils and bacon, since so many are so incomplete. But it looks like the hominins are relatively longer (front to back, or dorsoventrally) compared to the chimpanzee. That is, oriented along the rib “neck,” the ventral/distal end projects far more medially beyond the proximal vertebral facet in the chimp, while in the hominins the two ends are more flush. Ardi is really incomplete and so very hard to orient, but it may be more like the chimp (I think it needs to be rotated to the right more, to make the lateral edge more vertical like all the other specimens).
It will be interesting to see what my colleagues working on the Homo naledi thorax have to say about rib shapes and their functional importance, hopefully not too long from now.
Anyway, I really wish I had more bacon.
Fossil rib sources Dmanisi Homo erectus: Lordkipanidze D, Jashashvili T, Vekua A, Ponce de León MS, Zollikofer CP, Rightmire GP, Pontzer H, Ferring R, Oms O, Tappen M, Bukhsianidze M, Agusti J, Kahlke R, Kiladze G, Martinez-Navarro B, Mouskhelishvili A, Nioradze M, & Rook L (2007). Postcranial evidence from early Homo from Dmanisi, Georgia. Nature, 449 (7160), 305-10 PMID: 17882214
Australopithecus sediba: Schmid P, Churchill SE, Nalla S, Weissen E, Carlson KJ, de Ruiter DJ, & Berger LR (2013). Mosaic morphology in the thorax of Australopithecus sediba. Science, 340 (6129) PMID: 23580537
Australopithecus afarensis and Ardipithecus ramidus: White TD, Asfaw B, Beyene Y, Haile-Selassie Y, Lovejoy CO, Suwa G, & WoldeGabriel G (2009). Ardipithecus ramidus and the paleobiology of early hominids. Science, 326 (5949), 75-86 PMID: 19810190
A few weeks ago we examined sexual dimorphism – characteristic differences between males and females – in my Intro to Bioanthro class. Sexual dimorphism roughly correlates with aspects of social behavior in animals, and so we compared dimorphism in our class with what is seen in other primates. For the lab, we collected our body masses, heights, and lengths of our 2nd and 4th fingers, then I plotted the data and we went over it together.
When collecting data on your students, make sure to get permission from your institution and let students know they can opt out of sharing their personal data. I’ve also assigned students randomized ID numbers to help keep their data private and as anonymous as possible.
This activity builds on the first lab we did this year, measuring our head circumferences to estimate brain size and examining how this varies within the classroom. We saw then that our class’s males have larger brain (well, head) sizes than females. We hypothesized that this was simply due to body size differences – all else being equal, larger people should have larger brains. Now that we collected body mass data, we could test this hypothesis – in fact, when body mass is taken into account, our class’s females have larger brains than males:
Sexual dimorphism in brain size (left), body size (center), and brain size relative to body size (right).
These are sex differences based on raw numbers. Another way to look at dimorphism is to se the extent to which sexes deviate from a scaling relationship (“allometry”). Looking to the left plot below, there is a positive linear relationship between body and brain size: as body size increases, so does brain size. As we saw above, male values are elevated above females’ but there is overlap. Importantly, the right plot shows that deviations from this linear trend, quantified as residuals, are not significantly different for the two sexes. So even though females have large brains relative to their body size in absolute terms, this is not exceptional given how brain size scales with body size.
Brain-body allometry in our classroom. Males and females in our classroom do not seem to deviate appreciably from a common pattern of allometry.
While lab activities help students to understand patterns in data, this lab also shows students the importance of comparing patterns of variation. Students learn from readings and lectures that humans show relatively low levels of dimorphism, and this activity helps them see why we say that. Situating our data within the context of primate dimorphism and mating systems, they can ask if there is an adaptive or evolutionary significance behind our level of dimorphism.
Sexual dimorphism in our classroom compared with what is seen in primates with different mating systems and levels male-male competition. Our class values are the stars, and in the right plot blue is males and green is females. Figures from Plavcan (2012) and Nelson & Schultz (2010).
In this broader comparative context, students tackle what it means for human dimorphism, and ratios of the 2nd digit/4th digit, to be intermediate between what we see in monogamous vs. non-monogamous primates. This can lead some interesting class discussion.
References Nelson E, & Shultz S (2010). Finger length ratios (2D:4D) in anthropoids implicate reduced prenatal androgens in social bonding. American Journal of Physical Anthropology, 141 (3), 395-405. PMID: 19862809
Plavcan JM (2012). Sexual size dimorphism, canine dimorphism, and male-male competition in primates: where do humans fit in? Human Nature, 23 (1), 45-67. PMID: 22388772
Portishead* came on the radio the other day, making iTunes** display the cover of their album, Third. My inner osteologist rejoiced to see it prominently features a tooth!
Well not a picture, but rather the name, of a tooth. In each quadrant of your mouth (most likely) are two premolars, commonly referred to as “bicuspids.” In the biz, we usually call these two “P3” and “P4.”
UW 101-1277 mandible, part of the Homo naledi holotype skull. Each capital letter stands for the tooth type (incisor, canine, premolar, and molar). Modified from Wits’ image gallery.
You might be wondering why we call them P3 and P4, when there are only two premolars per quadrant — what happened to P1 and P2? Homology to the rescue!
The ancestral condition for (eutherian) mammals was to have four premolars (and a 3rd incisor) in each side of the jaw. This is a “dental formula” of 3-1-4-3, indicating the numbers of each tooth type from front to back. Over time, different groups of animals have lost some of these teeth. Baleen whales have lost all of them.
P1 and an incisor were lost early in the evolution of Primates. Most Strepsirrhines and Platyrrhine monkeys retain this ancestral “2-1-3-3″ dental formula :
Ring tailed lemur (left) and woolly monkey (right) maxillae, showing the primitive primate dental formula including a P2. For scale, gridlines are 10 mm (left) and 20 mm (right). Images from the sadly defunct CT database from the Kyoto University Primate Research Institute.
The last common ancestor of catarrhines (living humans, apes and Catarrhine monkeys) lost the P2, and so we have only two premolars left in each side of the jaw. These are homologous with the third and fourth premolars of the earliest mammals. And that’s why we call them P3-4.
*The song was “The Rip.” It’s a very good song with an insanely creepy and trippy video:
**This post dates to 2015—before iTunes became Apple Music.