Homo habilis just got some long arms to go along with its dexterous hands. In a recent paper in the journal The Anatomical Record, Fred Grine and colleagues describe and analyze some spectacular fossils recovered near the town of Ileret in Kenya, dating to just over 2 million years ago. There were a few different kinds of human-like species inhabiting the planet around this time, but researchers were able to assign these bones to Homo habilis thanks to some chemical clues connecting them to a nearly complete set of teeth found a few meters away. This partial skeleton of a young adult individual is an incredible discovery, connected by clever scientific sleuthing, and provides important information about an early member of the human lineage.
You can see some great photos of these fossils (as well as a fantastic fossil foot of a different individual) in a 2015 press release from the Turkana Basin Institute. A more recent announcement from the Institut Català Paleontologia includes a photo showing the late great Bill Jungers and fossil maven Meave Leakey with the fossils, which helps show the actual size of the bones.
Ann Gibbons’ article about the discovery has a great quote from paleoanthropologist Stephanie Melillo (who discovered the Burtele foot fossil): “If you dressed up a Homo habilis individual in clothes and you saw her walking in the distance, would you do a double take? This study shows us that the answer is YES!”
Artist’s depiction of Homo habilis dressed up in clothes and you see her walking in the distance (image source)
The reason we might react to seeing Homo habilis like Gertie glimpsing E.T., as this skeleton shows, is that this early human had longer arms (especially forearms) than most of us do today. Thickness of the bones also shows that they were probably quite strong as a result of experiencing lots of force from use during life. Long and strong hominin arms are typically interpreted as evidence that these ancient ancestors spent a good deal of time climbing trees.
These features have previously been documented in some of the few other partial skeletons attributed to Homo habilis, as Grine and colleagues note. Indeed, the new article does a deep dive into what is known (and unknown) about the bones and body of Homo habilis, and it also provides a thoughtful review of recent research cautioning against over-interpreting climbing behaviors from fossil remains.
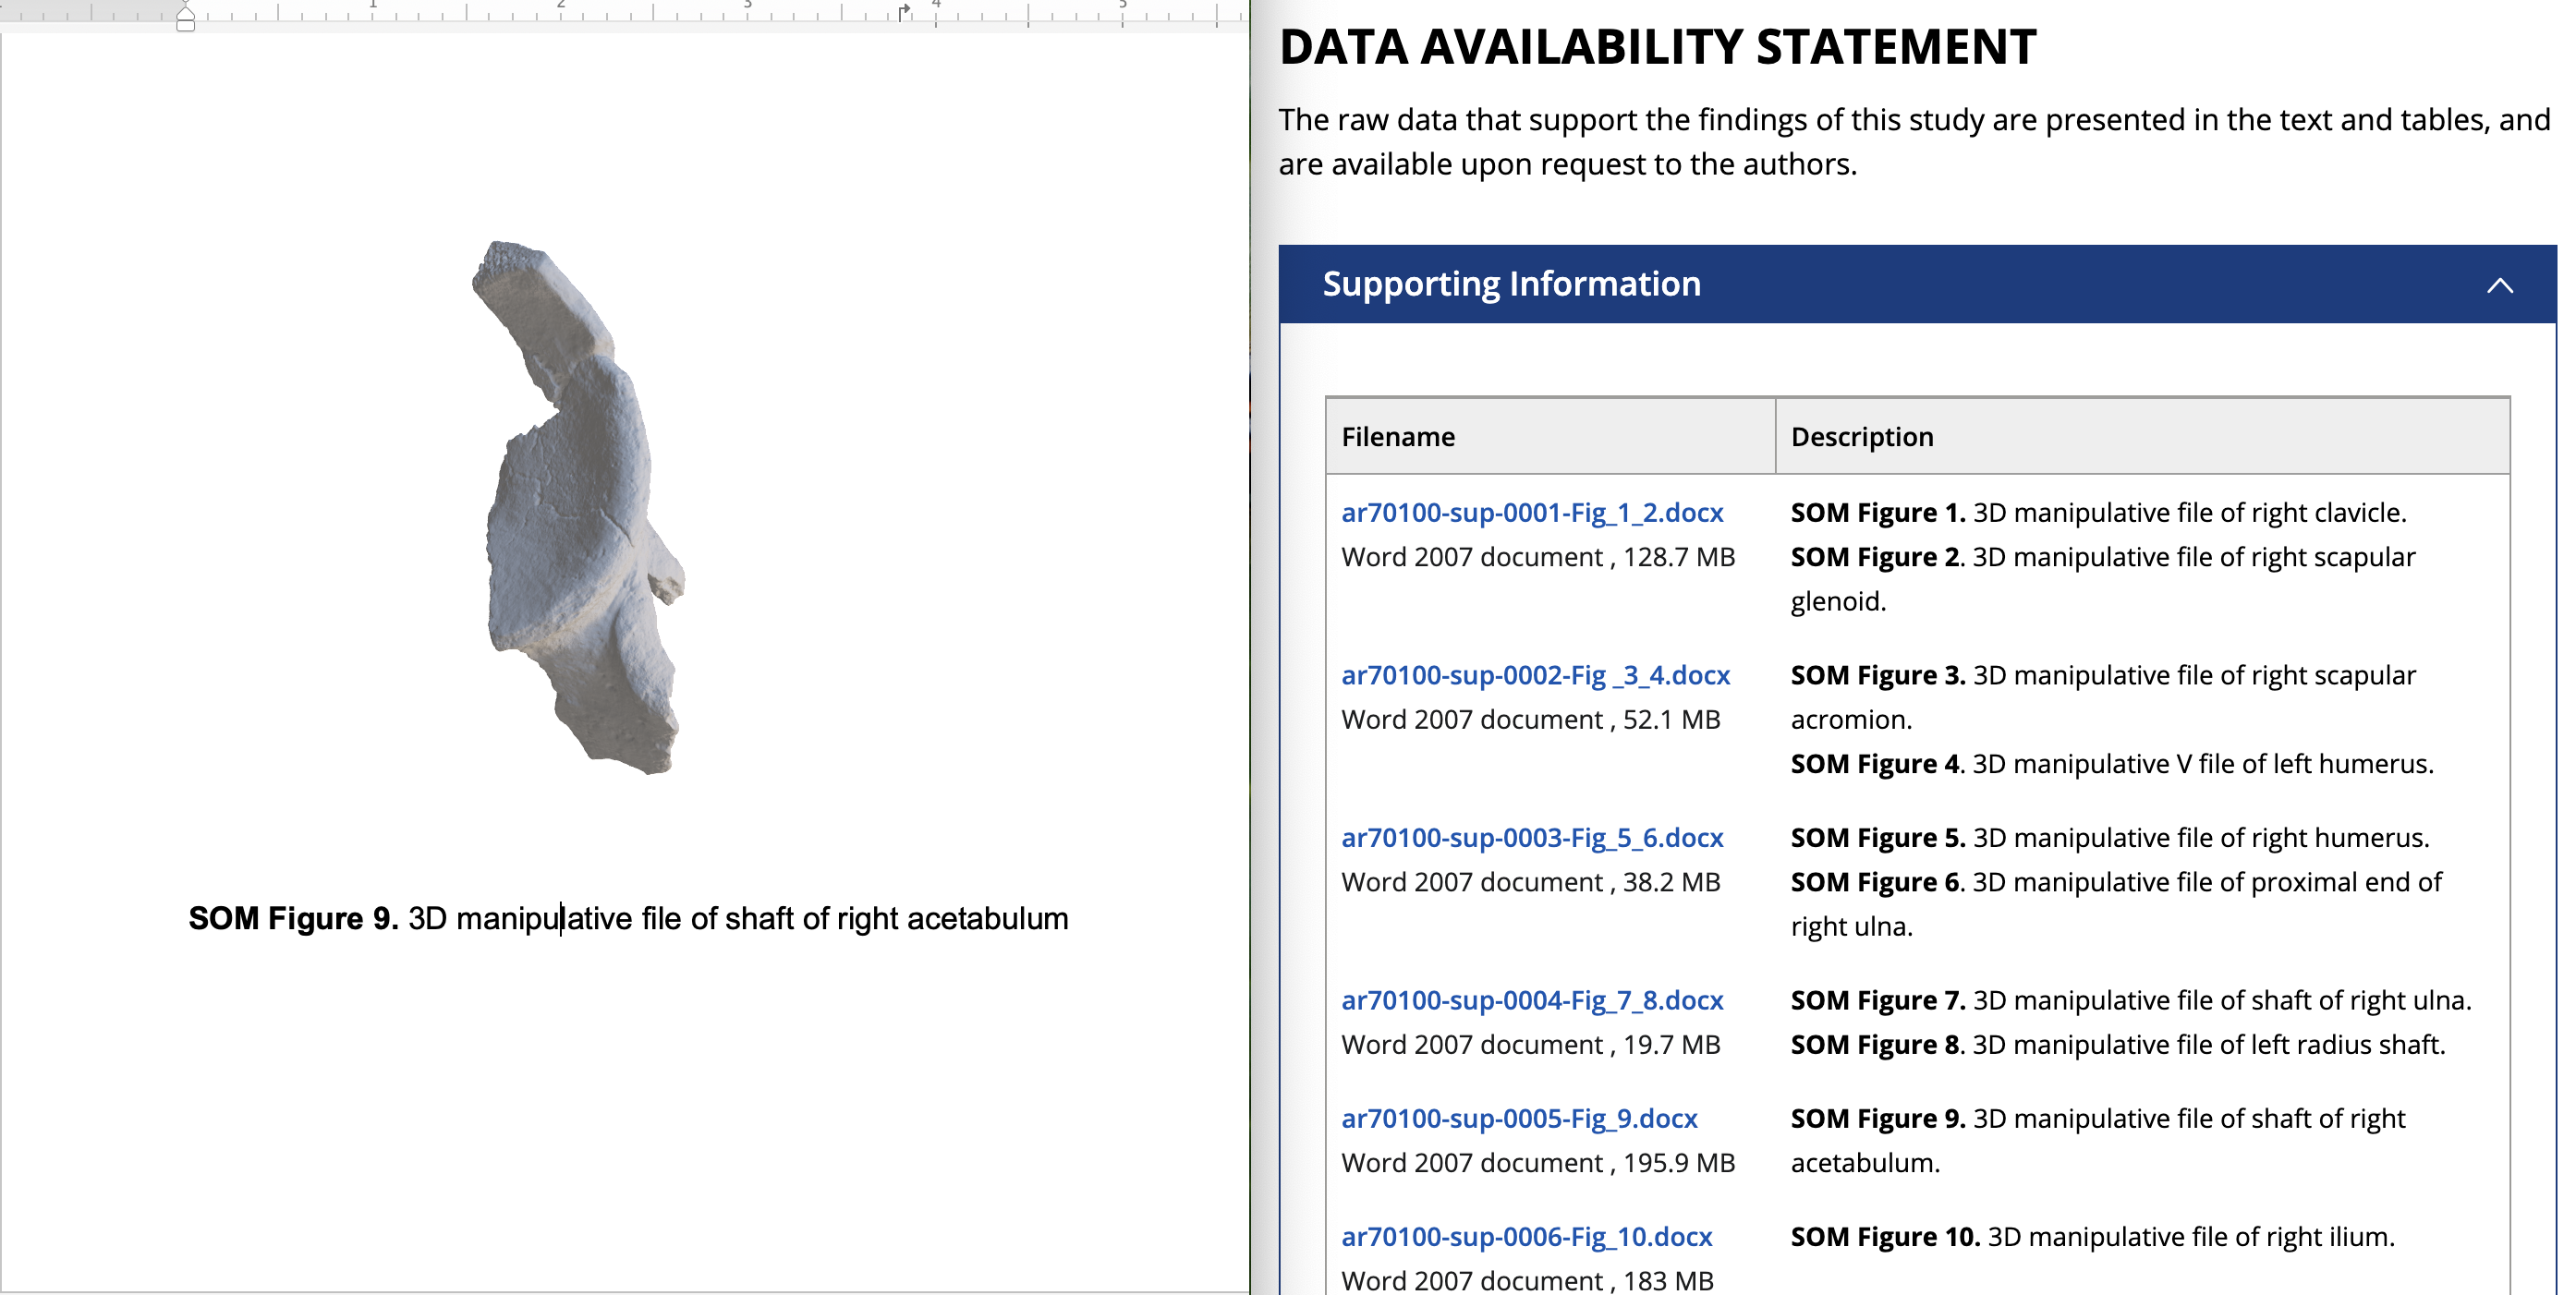
For more fossil fun, the article’s supporting online material includes “3D manipulative files” of the original specimens, so anyone can have a look at the bones in 3D using Microsoft Word:
For the first time in many years, I’m offering a new advanced undergrad seminar here at Vassar. When I arrived here 8 years ago, I was mainly thinking about Homo naledi and ontogeny, so those were the foci of my seminars. But my research has begun looking more at brain evolution and especially the evidence from fossil endocasts, and there is a lot of literature I need to catch up on.
So I’ve invited students along for this brainstorm, using the question “Is the human brain special?” as a starting point to learn about how the beautifully congealed soup sloshing around inside our skull makes us such quirky animals. In the first half of the semester we’ll read up on brain anatomy and structure, and students will use some of the fossil endocast data I’ve accrued over the years to learn more about a given brain region and extinct hominin. In the second half of the semester we’ll read about the brains, behavior, and endocast fossils of very distant relatives — invertebrates, birds, whales, and dogs — that have been celebrated for their own ‘advanced intelligence.’ We’ll also read about how the evolution of our brains may have predisposed us to certain conditions like addiction and Alzheimer’s, and how brain science has been exploited toward racist and sexist ends (increasingly relevant in America today, sadly).
It will be a lot of work (I’m a very slow, distractible reader) but I’m excited to delve into this literature and see what insights our super sharp students here at Vassar come up with in discussions and projects. The course syllabus (ANTH 323) is available on my Teaching page — I’d be keen to hear suggestions for readings and assignments from folks who know more about brains than I do!
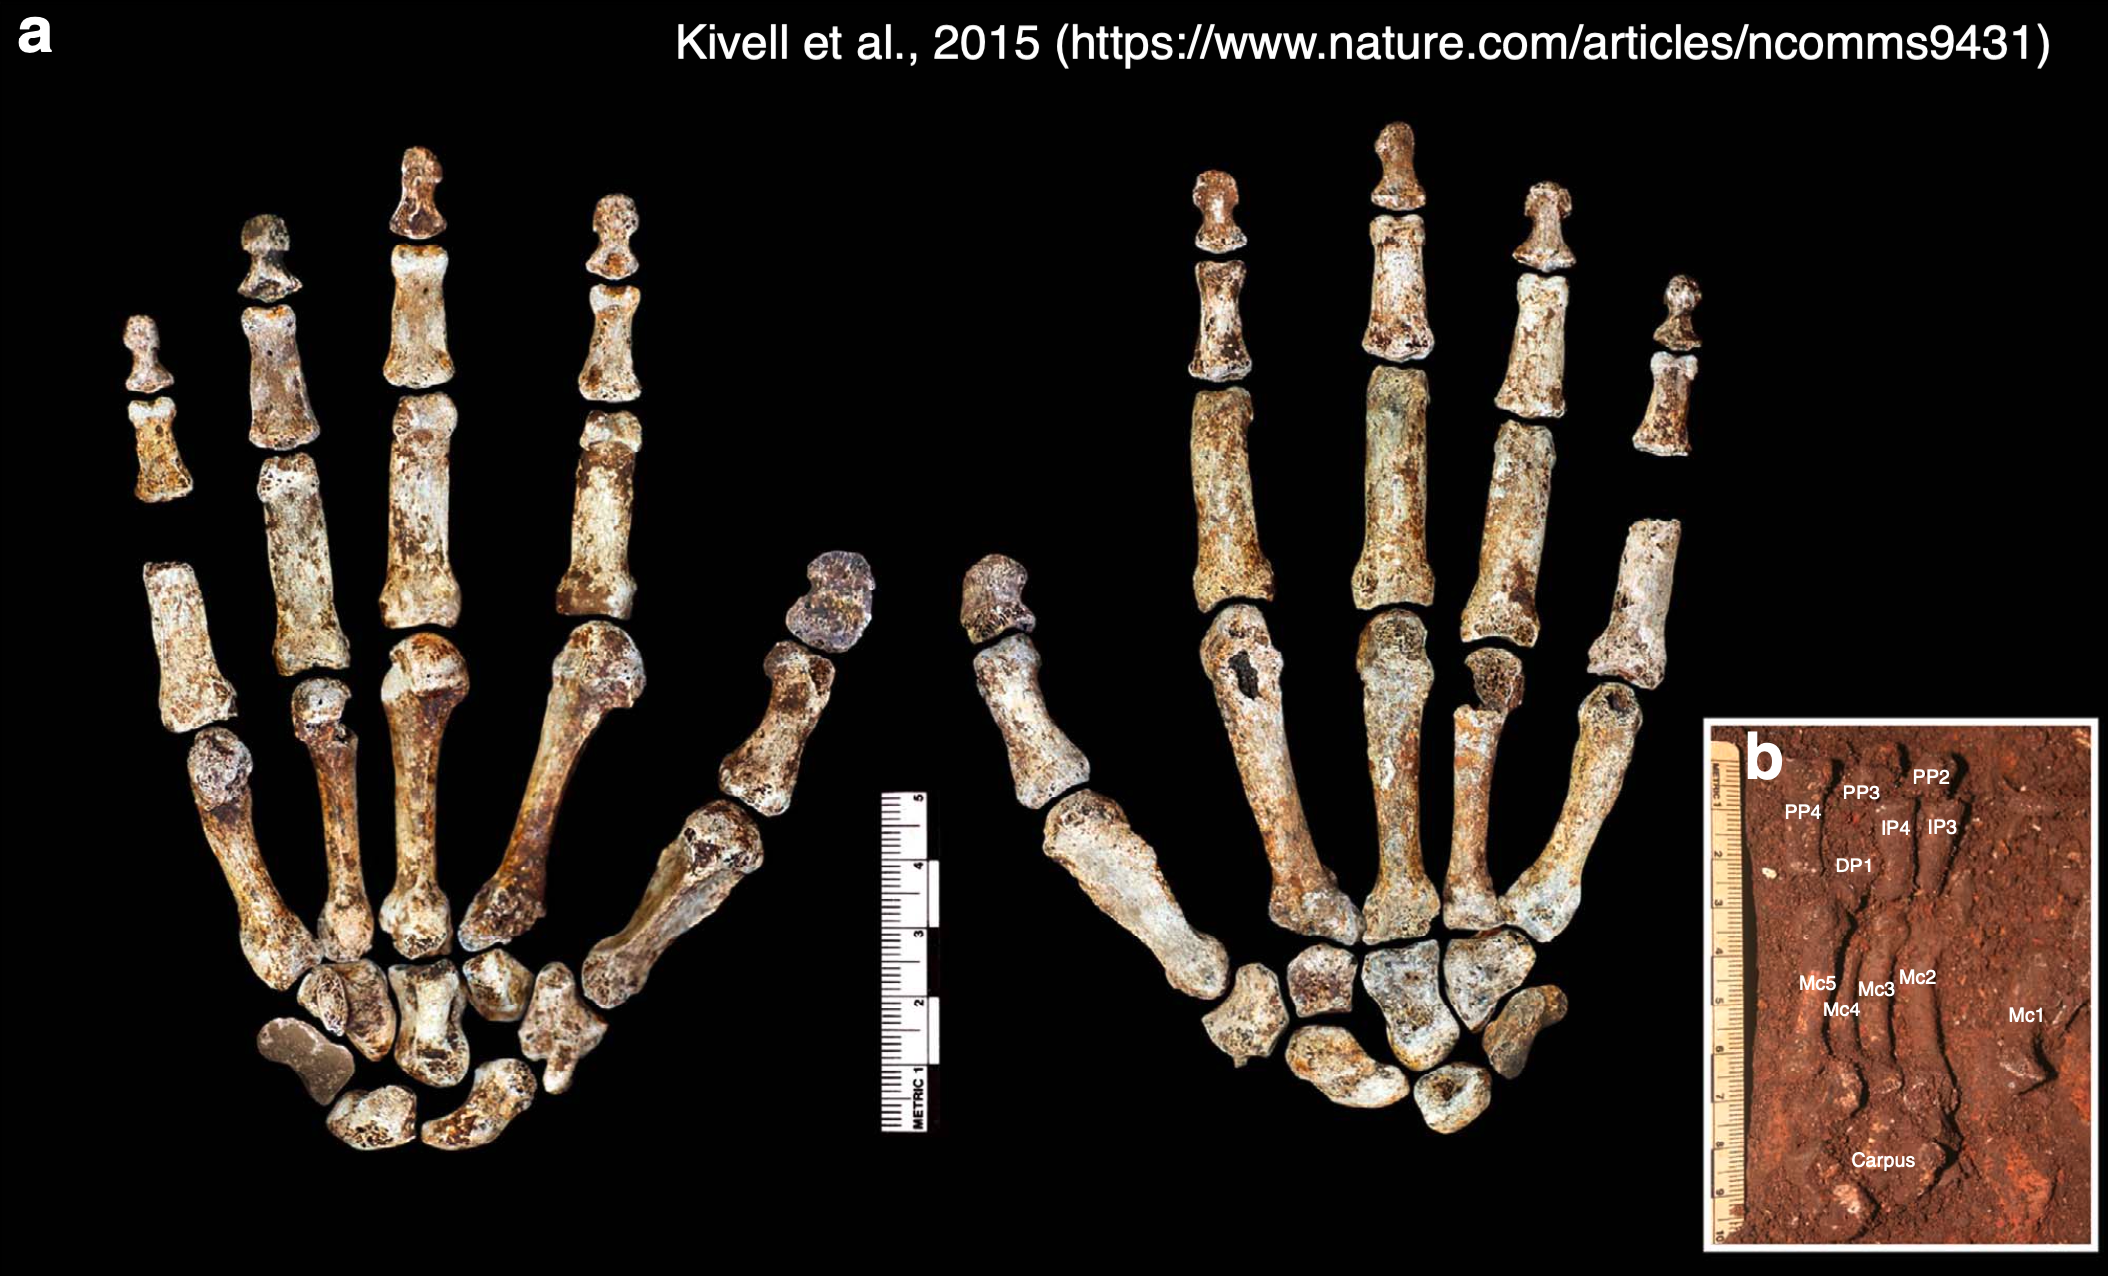
Homo naledi is one of my favorite extinct humans, in part because its impressive fossil record provides rare insights into patterns and process of growth and development. When researchers began recovering naledi fossils from Rising Star Cave 10 years ago, one of the coolest finds was this nearly complete hand skeleton. The individual bones were still articulated practically as they were in life so we know which bones belong to which fingers, allowing us grasp how dextrous this ancient human was. And since finger proportions are established before birth during embryonic development, we can see if Homo naledi bodies were assembled in ways more like us or other apes.
The “Hand 1” skeleton of Homo naledi, adapted from a figure by Kivell and colleagues (2015). Left shows the palm-side view while the middle shows the back of the hand. The inset (b) shows many of the palm and finger bones as they were found in situ in Rising Star Cave.
In a paper hot off the press (here), I teamed up with Dr. Tracy Kivell to analyze finger lengths of Homo naledi from the perspective of developmental biology. On the one hand, repeating structures such as teeth or the bones of a finger must be coordinated in their development, and scientists way smarter than me have come up with mathematical models predicting the relative sizes of these structures (for instance, teeth, digits, and more). On the other hand, the relative lengths of the second and fourth digits (pointer and ring fingers, respectively) are influenced by exposure to sex hormones during a narrow window in embryonic development: this ‘digit ratio’ tends to differ between mammalian males and females, and between primate species with different social systems.
So, Tracy and I examined the lengths of the three bones within the second digit (PP2, IP2, DP2) and of the first segment of the second and fourth digits (2P:4P) in Homo naledi, compared to published data for living and fossil primates (here and here). What did we find out?
Summary of our paper showing the finger segments analyzed (left), and graphs of the main results (right). The position of Homo naledi is highlighted by the blue star in each graph.
The first graph above compares the relative length of the first and last segments of the pointer finger across humans, apes, and fossil species. The dashed line shows where the data points are predicted to fall based on a theoretical model of development. There is a general separation between humans and the apes reflecting the fact that humans have a relatively long distal segment, which is important for precise grips when manipulating small objects. Fossil apes from millions of years ago and the 4.4 million year old hominin Ardipithecus are more like apes, while Homo naledi and more recent hominins are more like modern humans. Because both humans and apes fall close to the model predictions, this means the theoretical model does a good job of explaining how fingers develop. Because humans and apes differ from one another, this suggests a subtle ‘tweak’ to embryonic development may underlie the evolution of a precision grip in the human lineage, and that it occurred between the appearance of Ardipithecus and Homo.
The second graph compares the ‘digit ratio’ of the pointer and ring fingers from a handful of fossils with published ratios for humans and the other apes. Importantly, the digit ratio is high in gibbons (Hylobates) which usually form monogamous pair bonds, while the great apes (Pongo, Gorilla, Pan) are characterized by greater aggression and mating competition and have correspondingly lower digit ratios. Ever the bad primates, humans fall in between these two extremes. Most fossil apes and hominins have digit ratios within the range of overlap between the ape and human ratios, but Homo naledi has the highest ratio of all fossil hominins known, just above the human average. It has previously been suggested that humans’ higher ratio compared to earlier hominins may result from natural selection favoring less aggression and more cooperation recently in our evolution. If we can really extrapolate from digit proportions to behavior, this could mean Homo naledi was also less aggressive. This is consistent with the absence of healed skull fractures in the vast cranial sample (such skull injuries are common in much of the rest of the human fossil record).
You can see the amazing articulated Homo naledi hand skeleton for yourself on Morphosource. Its completeness reveals how handy Homo naledi was 300,000 years ago, and it can even shed light on the evolution of growth and development (and possibly social behavior) in the human lineage.
In the Summer of 2019 I worked with some great Vassar undergrads to make virtual endocasts and generate new brain size estimates for the Neandertals from the site of Krapina, which we then published in 2021 (discussed in this blog post). The virtual approach to endocast reconstruction uses 3D landmark-based geometric morphometrics methods, and so in the spirit of open science we also published all the landmark data used for the study (as well as a bunch of other fossil human brain size estimates) in the Zenodo repository (here).
Neandertal fossil specimens Krapina 3 (purple/green) and Krapina 6 (yellow/red) with preserved landmarks and virtually reconstructed endocasts.
Something major and global happened around that time — who can even remember what? — and so I never got around to posting R code to accompany the study. So, I’ve finally gotten around to adding some very basic code to the Zenodo entry (better late than never). The code simply reads in the landmarks, estimates missing data for fossils, and does some very basic shape analysis and visualization. It’s doesn’t get into all the nuts and bolts of our study, but it should be enough to help folks check our data or get started with shape analysis in R.
R code includes ways to visualize the landmark data. Left: Principal components analysis graph of endocast shape for humans (red) and Neandertals (blue). Right: Triangle meshes of the average human and Neandertal endocast shapes, viewed from the right, bottom, and back.
Original article Cofran Z, Boone M, Petticord M. 2021. Virtually estimated endocranial volumes of the Krapina Neandertals. American Journal of Physical Anthropology 174: 117–128. (link)
What makes the human brain special, and how did it change throughout our evolutionary history? One way to answer this question by comparing actual brains or MRI scans of living animals. But only fossils can show what changed and when over the past several million years, and sadly brains are basically an elaborately congealed soup that doesn’t stay fresh upon death, so they never fossilize (well, almost never). Happily, though, bones can preserve for millions of years, and they are literally molded by their soft and squishy surroundings. As the brain grows, it pushes outward against the inner surface of the skull, which can save the scars of the submerged cerebrum: nerds like me call these impressions an “endocast.”
Endocasts of Homo naledi (pink) and Homo erectus (yellow). Fossils are viewed from the left side and are variably preserved.
Nicole Labra and Antoine Balzeau have led a cool study, hot off the press, examining what such endocasts can tell us about the underlying brain anatomy. Importantly, they show how difficult it is to clearly and consistently identify many brainy boundaries. This is very salient in “paleoneurology,” the study of brain evolution especially based off endocasts: the problem probably best illustrated by the nearly century-long debate about the natural endcoast of the “Taung child” fossil (Australopithecus africanus).
Labra & colleagues used a clever approach to address this paleontological and epistemological problem. They first generated an endocast directly associated with its brain from an MRI scan of a living human, allowing them see precisely where specific brain grooves (“sulci”) lay relative to the endocast surface. They then asked a bunch of researchers—myself included—to try to identify sulci on the endocast, and then looked at how our responses compared to both one another’s and to the actual, known sulcus positions.
Figure 1 from Labra et al. (in press) showing how the brain and endocast were obtained and analyzed.
Their analysis showed that we varied quite a bit in our identifications on the endocast. As Emiliano Bruner (who also participated) discusses in his blog post, we tended to identify the stronger impressions toward the bottom and sides of the endocast better and more consistently. Some of this variability and uncertainty among researchers is due to the faintness and incompleteness of many brain impressions, and some due to biased expectations about where a given sulcus “should” be based on our previous experiences and published references.
When Antoine Balzeau first contacted me about this project, I was just beginning to dabble in paleoneurology, learning some brain anatomy for the first time for a description of an old Australopithecus endocast called “MLD 3.” I initially thought MLD 3 would be a quick and simple study—boy was I spectacularly disappointed!
Figure 3 from Cofran et al. 2023, comparing two different chimpanzee brains, and two corresponding interpretations of the MLD 3 endocast.
Probably reflecting observer bias and desire for definitive results, we initially interpreted the endocast impressions on MLD 3 as representing a ‘human-like’ anatomy that is super rare in living chimpanzees (namely the “LS” depicted in the right half of the figure above). The researchers who peer-reviewed the first draft of our paper, though, suggested we be more cautious in our interpretations; one reviewer outright disagreed with us in support of a more ‘ape-like’ interpretation (left half of the figure above). The review process alone underscored the subjectivity and uncertainty in analyzing endocasts. In the end we presented both interpretations, and I honestly don’t know which (if either) is most likely to be correct. So the study by Labra and colleagues provides a nice empirical illustration of this cranial conundrum.
Fortunately, researchers are developing methods to help identify brain structures on endocasts. Amélie Beaudet, Jean Dumoncel, and Edwin de Jager among others have done some really impressive work looking at variability in both brains (for instance here) and endocasts (for instance here). By using computer-based 3D data and methods, these researchers have shown where many brain sulci tend to be located (see here). By developing a better understanding of variation in where sulci sit on an endocast, we can have a better idea of which sulci might be represented on fossil endocasts, which in turn can tell us about the brains of our extinct relatives. Edwin and Amélie presented a very cool new analysis of Australopithecus/Paranthropus boisei endocasts, building off this digital approach, at the recent ESHE conference. And as noted in our MLD 3 paper, I think machine learning and other ‘artificial intelligence’ approaches could also help us identify ambiguous features from frustrating fossil fragments.
I’m working on a project analyzing infant remains of Homo naledi, a species of human that lived in South Africa around 300,000 years ago. In order to paint a full picture of infancy in this species, we need to estimate how big (or small) naledi newborns were. But without fossil neonates that could provide direct evidence of body size at birth, this is a tricky task.
Ideally, we could simply use adult body size estimates for Homo naledi to predict its body size at birth, using the scaling relationship in other primates as a guide. For example, using an average adult body size of 44 kg for Homo naledi (Garvin et al., 2017) yields an estimated newborn size of around 1.5 kg, based on published primate dataset (Barton and Cappellini, 2011). But this approach necessarily overlooks variation within each species, not to mention variation and uncertainty in Homo naledi adult size. In addition, the 95% prediction interval for this estimate ranges from under 1 kg (smaller than an average baboon baby) to almost as large as a human neonate.
Primate body size scaling (Barton & Cappellini, 2011). The black line is the regression for catarrhines (purple squares and blue circles), and the shaded grey area is the 95% prediction interval for newborns at a given adult catarrhine size.
And this gets at the other issue with the regression-based approach to estimating newborn body size in fossil hominins: humans are bad at being primates in some ways, as illustrated here by the fact that we don’t fit the newborn-adult body size relationship that characterizes other catarrhines (apes and monkeys of Africa and Eurasia).
Humans give birth to collosal kids. In contrast, gorillas are the largest living primates as adults, but their newborns are only a little over half the size of human neonates. Why do we have such giant babies? The most proximate reason is that humans are born with adult-ape-sized brains and quite a bit of baby fat as far as mammals go (Kuzawa, 1998). This tells us how babies are big, but it still begs the ultimate question of why—an enduring puzzle that you may have read about in the New York Times last week.
In order to land on a reasonable estimate of newborn body size in extinct humans, we need to figure out when evolution blew up the kid. Unfortunately, the only fossil hominin neonates are two Neandertals from France and Russia dating to under 100,000 years ago—pretty remarkable, but they don’t necessarily tell us about earlier species like Homo naledi.
My colleague Jerry Desilva (2011) worked out a potential solution to this conundrum. He argued that one could work from adult brain size to newborn body size through the following steps. First, in contrast to newborn-adult body size scaling, humans are good catarrhines when it comes to newborn-adult brain size scaling. This means that we can reasonably estimate newborn brain size based on adult brain sizes, which are aplenty in the human fossil record. Second, humans and many other primate newborns have brains roughly 12% of their overall body mass, while the great ape newborns stand out with brains around 10% of their adult size. Putting these two pieces together, one could estimate newborn body size: Adult brain ➡️ newborn brain ➡️ 10–12% newborn body size
DeSilva showed that regardless of whether you use an ape or human model of newborn brain/body size, hominin babies from Australopithecus afarensis 3 million years ago onward were probably large relative to maternal body size, estimated independently using skeletal remains. It’s a bit of a tortuous approach to estimating body size at birth, but the assumptions are reasonable and it’s probably the best way to figure out this important life history variable given the fossil evidence. What does this mean for Homo naledi?
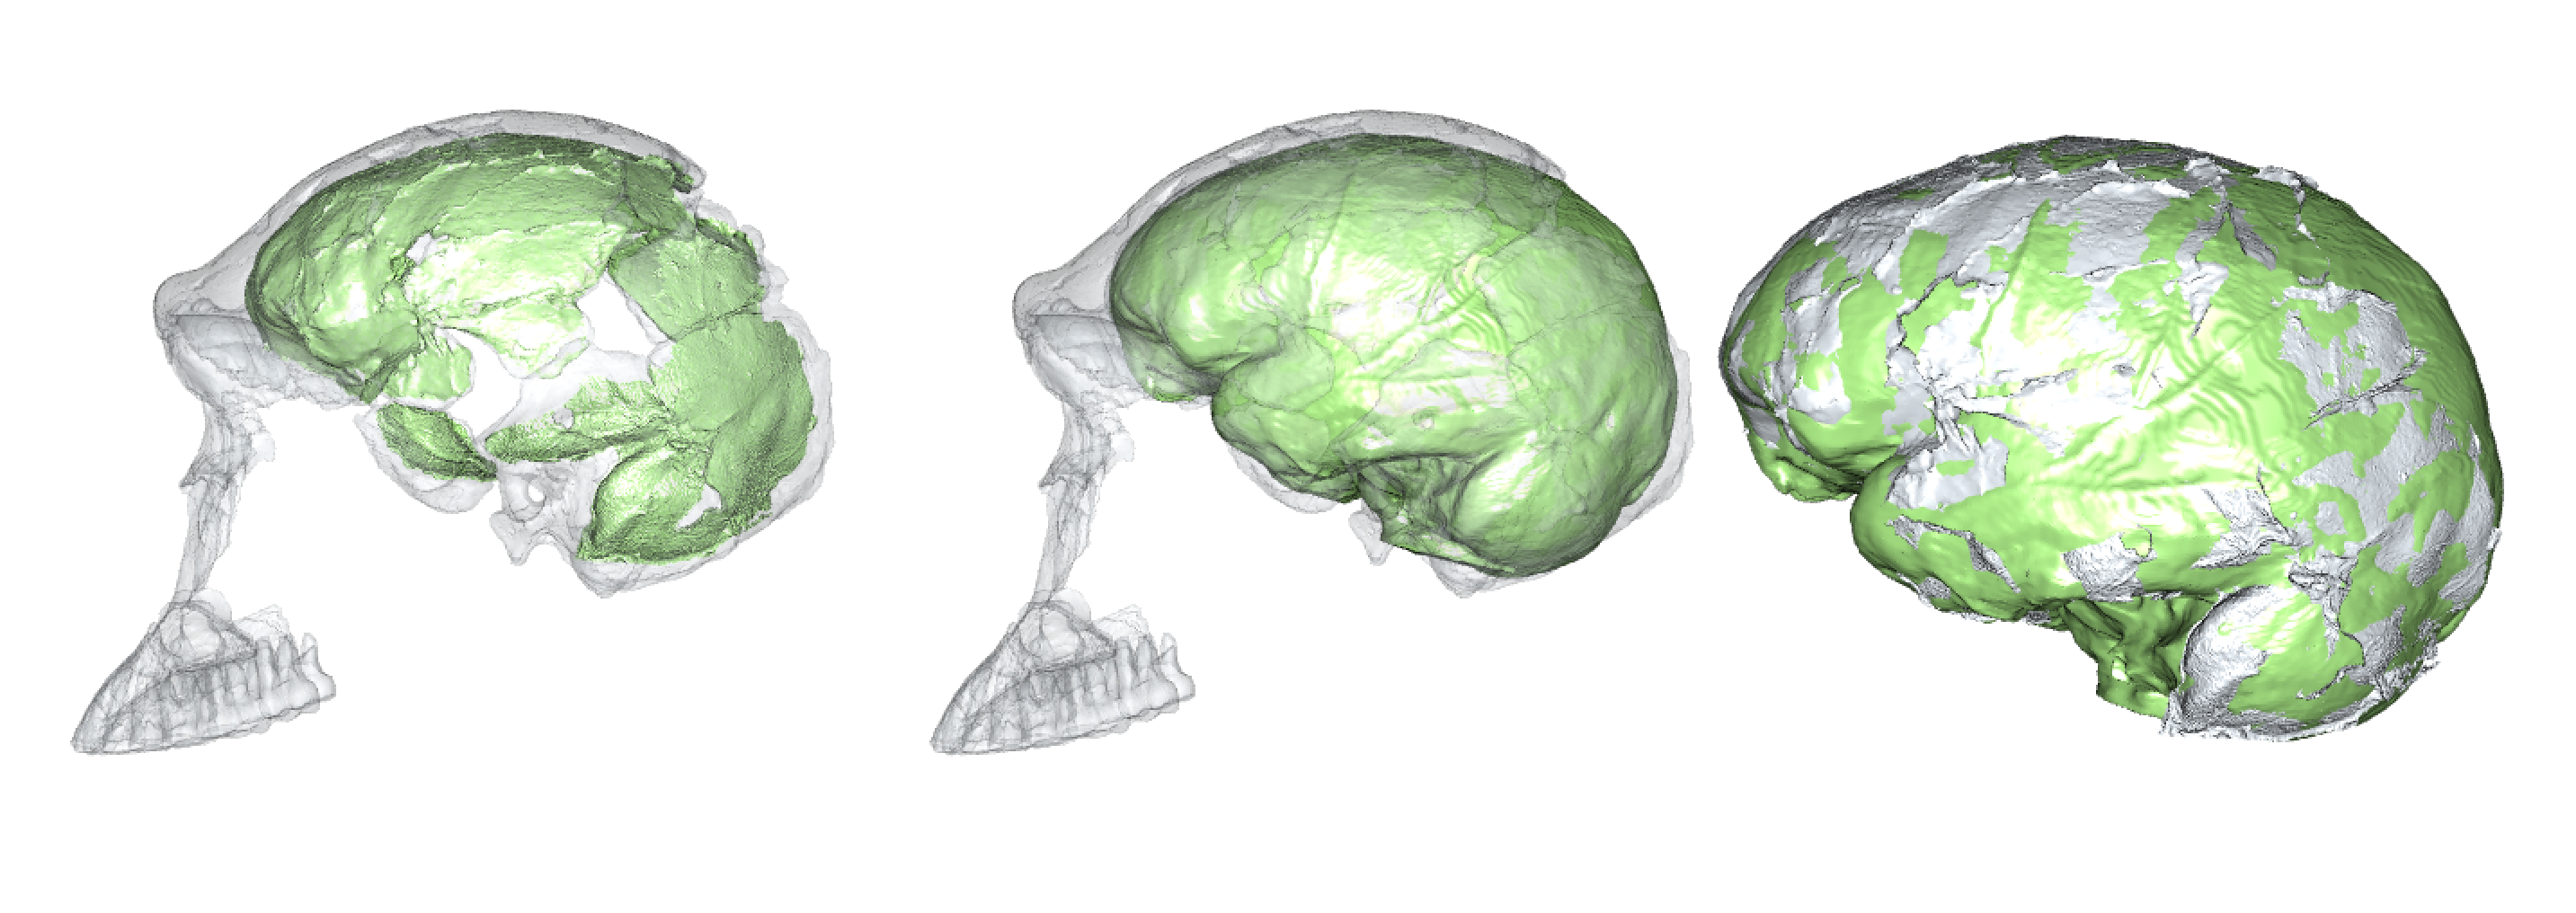
Virtual reconstruction of brain size and shape of the Homo naledi cranium “Neo” (work in progress). At 610 cm3, this is the largest and most complete Homo naledi endocast.
There are a few reliable adult brain size estimates for naledi, ranging from 465–610 cm3 (Berger et al., 2015; Garvin et al., 2017; Hawks et al., 2017), which based on catarrhine scaling would predict newborn brain size of around 170–210 cm3 (DeSilva and Lesnik, 2008). These brain sizes would then predict newborn body sizes of around 1.4–2.1 kg: the smol estimate is based on the smallest naledi adult brain size and a human model of newborn brain/body size; the chonk estimate is based on the largest naledi brain size and an ape brain/body model (pinkish stars in the boxplot below, left).
Boxplots of newborn body size in great apes. Gorilla, Chimpanzee, and Bonobo data from the Primate Aging Database(Kemnitz, 2019).
So, did Homo naledi have big babies? On the one hand, no: these 1.4–2.1 kg naledi newborns are outside the human range, and within the range of living great apes.
On the other hand, maybe Homo naledi babies were relatively large, though this depends on the size of Homo naledi adults. Recall from earlier that Garvin and colleagues arrived at an average estimated adult size of 44.2 kg. But this is an average of estimates for 20 separate naledi fossils, and each of these estimates has its own range of uncertainty. Garvin and team reported that the extremes of the prediction intervals for these estimates ranged from 28–62 kg. The second boxplot above shows newborn size relative to the adult average (sexes combined) for each species: for naledi, the six labels compare the smol and large newborn sizes (1.4 and 2.1 kg) with the adult average and extremes (28, 44, and 62 kg). Assuming the ‘true’ naledi sizes are somewhere in the middle of the range of estimates, naledi likely gave birth to babies 3–5% of adult body size, somewhat ‘intermediate’ between chimpanzees and humans (and bonobos…?) and similar to what DeSilva found for other hominins.
This is just a preliminary look at infancy in Homo naledi. There is a lot of uncertainty in these size estimates, but we should still be able to make some interesting inferences about growth and life history in our extinct evolutionary cousin.
REFERENCES
Barton, R. A., & Capellini, I. (2011). Maternal investment, life histories, and the costs of brain growth in mammals. Proceedings of the National Academy of Sciences, 108(15), 6169–6174. https://doi.org/10.1073/pnas.1019140108
Berger, L. R., Hawks, J., de Ruiter, D. J., Churchill, S. E., Schmid, P., Delezene, L. K., … Zipfel, B. (2015). Homo naledi, a new species of the genus Homo from the Dinaledi Chamber, South Africa. ELife, 4, e09560. https://doi.org/10.7554/eLife.09560
DeSilva, J. M. (2011). A shift toward birthing relatively large infants early in human evolution. Proceedings of the National Academy of Sciences, 108(3), 1022–1027. https://doi.org/10.1073/pnas.1003865108
DeSilva, J. M., & Lesnik, J. J. (2008). Brain size at birth throughout human evolution: A new method for estimating neonatal brain size in hominins. Journal of Human Evolution, 55(6), 1064–1074. https://doi.org/10.1016/j.jhevol.2008.07.008
Garvin, H. M., Elliott, M. C., Delezene, L. K., Hawks, J., Churchill, S. E., Berger, L. R., & Holliday, T. W. (2017). Body size, brain size, and sexual dimorphism in Homo naledi from the Dinaledi Chamber. Journal of Human Evolution, 111, 119–138. https://doi.org/10.1016/j.jhevol.2017.06.010
Hawks, J., Elliott, M., Schmid, P., Churchill, S. E., Ruiter, D. J. de, Roberts, E. M., … Berger, L. R. (2017). New fossil remains of Homo naledi from the Lesedi Chamber, South Africa. ELife, 6, e24232. https://doi.org/10.7554/eLife.24232
Kuzawa, C. W. (1998). Adipose tissue in human infancy and childhood: An evolutionary perspective. American Journal of Physical Anthropology, 107(S27), 177–209. https://doi.org/10.1002/(SICI)1096-8644(1998)107:27+<177::AID-AJPA7>3.0.CO;2-B
Each year in my intro bio-anthro class, we start the course by asking how our brains contribute to making us humans such quirky animals. Our first lab assignment in the class uses 3D models of brain endocasts, to ask whether modern human and fossil hominin brains are merely primate brains scaled up to a larger size. In the Before Times, students downloaded 3D meshes that I had made, and study and measure them with the open-source software Meshlab. But since the pandemic has forced everyone onto their own personal computers, I made the activity all online, to minimize issues arising from unequal access to computing resources. And since it’s all online, I may as well make it available to everyone in case it’s useful for other people’s teaching.
The lab involves taking measurements on 3D models on Sketchfab using their handy measurement tool, and entering the data into a Google Sheets table, which then automatically creates graphs, examines the scaling relationship between brain size (endocranial volume, ECV) and endocast measurements, and makes predictions about humans and fossil hominins based off the primate scaling relationship. Here’s the quick walk-through:
Go to the “Data sources” tab in the Google Sheet, follow the link to the Sketchfab Measurement Tool, and copy the link to the endocast you want to study (3D models can only be accessed with the specific links).
Following the endocast Sketchfab link (column D) will bring you to a page with the 3D endocast, as well as some information about how the endocast was created and includes its overall brain size (ECV in cubic cm). Pasting the link when prompted in the Measurement Tool page will allow you to load, view, and take linear measurements on the endocast.
Hylobates lar endocast, measuring cerebral hemisphere length between the green and red dots.
Sketchfab makes it quite easy to take simple linear measurements, by simply clicking where you want to place the start and end points. The 3D models of the endocasts are all properly scaled, and so all measurements that appear in the window are in millimeters.
The assignment specifies three simple measurements for students to take on each endocast (length, width, and height). In addition, students get to propose a measurement for the size of the prefrontal cortex, since our accompanying reading (Schoenemann, 2006) explains that it is debated whether the human prefrontal is disproportionately enlarged. All measurements are then entered into the Google Sheet — I wanted students to manually enter the ECV for each endocast, to help them appreciate the overall brain size differences in this virtual dataset (size and scale are often lost when you have to look at everything on the same-sized 2D screen).
Feel free to use or adapt this assignment for your own classes. The assignment instructions can be found here, and the data recording sheet (with links to endocast 3D models) can be found here — these are Google documents that are visible, but you can save and edit them by either downloading them or making a copy to open in Docs or Sheets.
Last month I was flying down to New Orleans for the AAPA conference. I was excited to try authentic beignets & sazeracs, present new research, and catch up with colleagues. Midway through the flight I glanced out the window, not expecting to see much. But lo!
Thankfully there wasn’t something on the wing. But there was something strange out there in the sparkle of sprawling city lights:
What’s that I spy outside the city center?
A bit outside of the main jumble of street lamps appears to be a concentration of light superficially similar to an incus, one of the three auditory ossicles of the middle ear:
Left: An osteologist’s nightmare at 20,000 feet. Right: Ear ossicles from White et al. (2012).
As a good mammal, there are three small bones inside your middle ear. These are fully formed at birth, and help transfer and amplify sound vibrations from your eardrum to your inner ear. It’s nuts. What’s even more nuts is that paleontologists and anatomists have figured out that the tiny, internal incus and malleus of mammals evolved from larger, external pieces of the jaws of our pre-mammalian ancestors. INSANITY!
Cross section of a right ear, viewed from the front. Image credit.
Being so tiny, it’s not surprising that auditory ossicles are not often recovered from skeletal remains, and are pretty rare in the human fossil record. Nevertheless, some are known and their comparison with humans’ ossicles is pretty interesting. The oldest incudes (yes, the plural of incus is incudes) I know of are from SK 848 and SKW 18, Australopithecus robustus fossils from Swartkrans in South Africa (Rak and Clarke, 1979; Quam et al., 2013). SK 848 is on the left in the set of images below:
Incus bones in three different views of SK 848, human chimpanzee, gorilla, sock puppet (left to right). Modified from Rak and Clarke, 1979.
SK 848 to differs from humans and African apes in looking more like a screaming sock puppet with a horn on the back of its head. Additional ossicles are known from South African australopithecines, including the older A. africanus from Sterkfontein (Quam et al., 2013). Interestingly, malleus of these hominins is very similar to that of humans, and Quam et al. (2013) think this ossicle may be one of the first bones in the entire skeleton to take on a human-like configuration during hominin evolution. Functionally, this may mean that the frequency range to which human ears are adapted may have appeared pretty early in our lineage as well (Quam et al., 2015).
Who’d’ve thunk we’d learn so much just from looking out an airplane window?
Read more!
Quam, R., de Ruiter, D., Masali, M., Arsuaga, J., Martinez, I., & Moggi-Cecchi, J. (2013). Early hominin auditory ossicles from South Africa Proceedings of the National Academy of Sciences, 110 (22), 8847-8851 DOI: 10.1073/pnas.1303375110
Quam, R., Martinez, I., Rosa, M., Bonmati, A., Lorenzo, C., de Ruiter, D., Moggi-Cecchi, J., Conde Valverde, M., Jarabo, P., Menter, C., Thackeray, J., & Arsuaga, J. (2015). Early hominin auditory capacities Science Advances, 1 (8) DOI: 10.1126/sciadv.1500355
Rak Y, & Clarke RJ (1979). Ear ossicle of australopithecus robustus. Nature, 279 (5708), 62-3 PMID: 377094
Last week in my Human Evolution class we looked at whether we could estimate hominin brain sizes, or endocranial volumes (ECV), based on just the length and width of the bony brain case. Students took these measurements on 3D surface meshes…
Maximum cranial length in Australopithecus boisei specimen KNM-ER 406.
… and then plugged their data into equations relating these measurements to brain size in chimpanzees (Neubauer et al., 2012) and humans (Coqueugniot and Hublin, 2012).
The relationship between cranial length (x axis) and ECV (y axis). Left shows the chimpanzee regression (modified from Fig. 2 in Neubauer et al., 2012), while the right plot is humans (from the Supplementary Materials of Coqueugniot and Hublin, 2012).
So in addition to spending time with fossils, students also learned about osteometric landmarks with fun names like “glabella” and “opisthocranion.” More importantly, students compared their estimates with published endocranial volumes for these specimens, based on endocast measurements:
Human and chimpanzee regression equations don’t do great at predicting hominin brain sizes. Each point is a hominin fossil, the x value depicting its directly-measured endocranial volume and the y value its estimated volume based on different regression equations. Black and red points are estimates based on chimpanzee cranial width and length, respectively, while green and blue points are based on human width and length, respectively. The dashed line shows y=x, or a correct estimate.
This comparison highlights the point that regression equations might not be appropriate outside of the samples on which they are developed. Here, estimates based on the relationship between cranial dimensions and brain size in chimpanzees tend to underestimate fossils’ actual values (black and red in the plot above), while the human regressions tend to overestimate hominins’ brain sizes. Students must think about why these equations perform poorly on fossil hominins.
Here are the lab materials so you can use and adapt this for your own class:
References Coqueugniot, H., & Hublin, J. (2012). Age-related changes of digital endocranial volume during human ontogeny: Results from an osteological reference collection American Journal of Physical Anthropology, 147 (2), 312-318 DOI: 10.1002/ajpa.21655
Neubauer, S., Gunz, P., Schwarz, U., Hublin, J., & Boesch, C. (2012). Brief communication: Endocranial volumes in an ontogenetic sample of chimpanzees from the taï forest national park, ivory coast American Journal of Physical Anthropology, 147 (2), 319-325 DOI: 10.1002/ajpa.21641
Jurassic Park is objectively the greatest film ever made, so I don’t need to explain why I recently watched it for the bajillionth time. Despite having seen this empirically excellent movie countless times, I finally noticed something I’d never seen before.
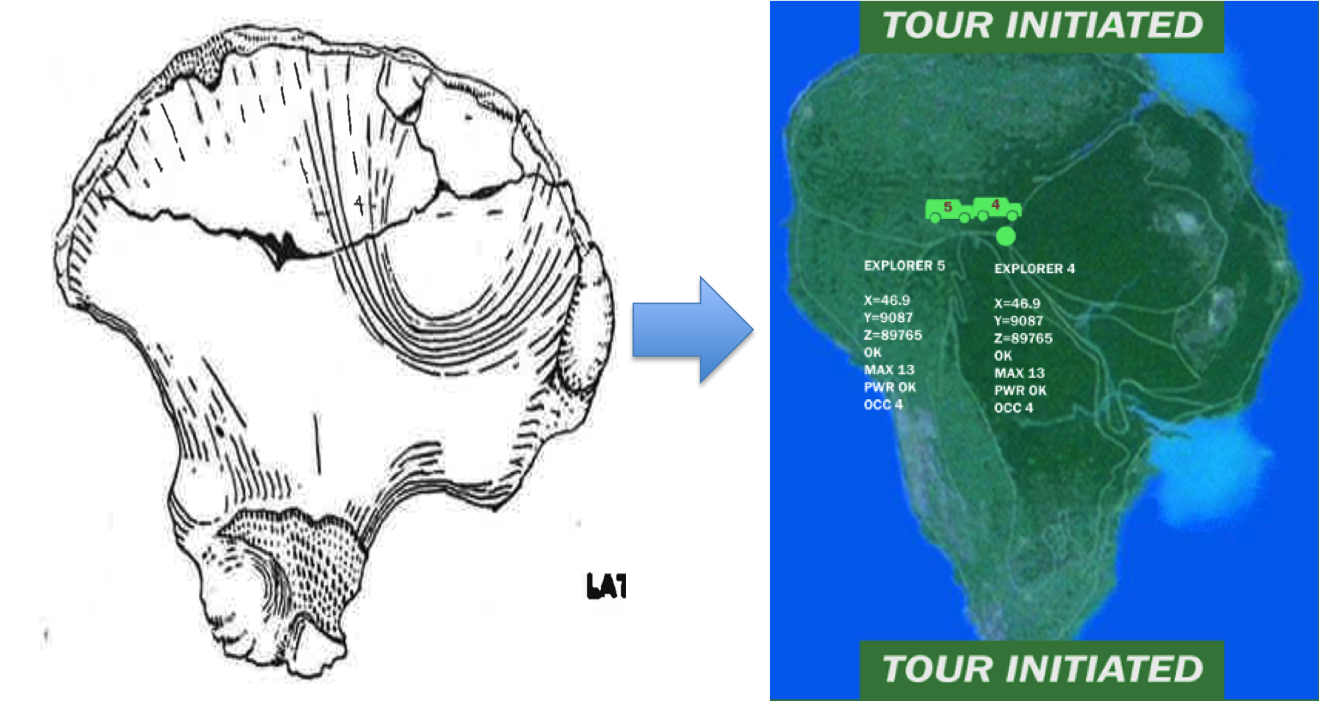
The film takes place on the fictitional island “Isla Nublar,” a map of which features prominently in the computer control room when s**t starts to go down. Here’s a clearer screenshot of one of Dennis Nedry‘s monitors:
Isla Nublar from the JP control room. Quiet, all of you! They’re approaching the tyrannosaur paddock…. (image credit)
It dawned on me that the inspiration for this island is none other than MLD 7, a juvenile Australopithecus africanus ilium from the Makapansgat site in South Africa:
Figure 1 from Dart, 1958. Left side is MLD 7 and right is MLD 25. Top row is the lateral view (from the side) and bottom row is the medial view (from the inside). These two hip bones are from the left side of the body (see the pelvis figure in this post). Note the prominent anterior inferior iliac spine on MLD 7, a quintessential feature of bipeds.
Isla Nublar is basically MLD 7 viewed at an angle so that appears relatively narrower from side to side:
MLD 7 at a slightly oblique view (or stretched top to bottom) magically transforms into Isla Nublar.
It’s rather remarkable that some of the most complete pelvic remains we have for australopithecines are two juveniles of similar developmental ages and sizes from the same site. In both, the iliac crest is not fused, and joints of the acetabulum (hip socket) hadn’t fused together yet. The immaturity of these two fossils matches what is seen prior to puberty in humans and chimpanzees. Berge (1998) also noted that MLD 7, serving as an archetype for juvenile Australopithecus, is similar in shape to juvenile humans, whereas adult Australopithecus (represented by Sts 14 and AL 288) are much flatter and wider side to side. Berge took this pattern of ontogenetic variation to match an ape-like pattern of ilium shape growth. This suggests a role of heterochrony in the evolution of human pelvic shape, or as Berge (1998: 451) put it, “Parallel change in pelvic shape between human ontogeny and hominid phylogeny.” In layman’s terms, ‘similar changes in both pelvic growth and pelvis evolution.’