Ancient DNA studies keep on delivering awesome findings about human evolution. Continuing this trend, Matthias Meyer and colleagues report today in Nature nuclear DNA (nDNA) sequenced from ~430,000 year old humans from the Sima de los Huesos (SH) site in Spain. SH is badass not only because the name translates as “pit of bones,” but also because the pit has yielded hordes of fossils comprising at least 28 people (Bermudez de Castro et al., 2004), and some of these bones preserve the oldest human DNA yet recovered (Meyer et al., 2013).

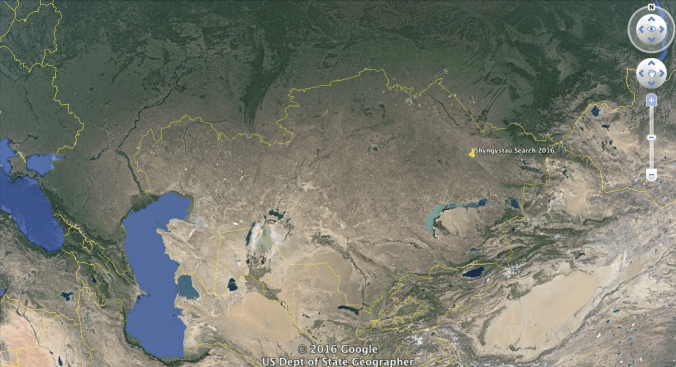
Point 1 in Northern Spain, is Sima de los Huesos. The rest of the points are other sites where hominin fossils preserve ancient DNA. Figure 1. From Meyer et al. 2013.
Anatomically, the SH hominins have been interpreted as “pre-Neandertals,” having many, but not all, of the characteristics of geologically younger fossils we know as Neandertals. Mitochondrial DNA (mtDNA) obtained from one of the SH femurs was found, surprisingly,to be more similar to Densivan than to Neandertal mtDNA (Meyer et al., 2013), not what would be expected if the SH hominins were early members of the Neandertal lineage. Meyer et al. interpreted this to mean that perhaps the SH hominins were ancestral to both Neandertals and Denisovans, though they noted that nDNA would be necessary to uncover the true relationships between these fossil groups.
Writing about the SH mtDNA in 2013, I noted that mtDNA has failed to reflect hominin relationships before. The distinctiveness of Denisovan mtDNA initially led to the idea that they branched off before the Neandertal-modern human population divergence (Kraus et al. 2010), and therefore that humans and Neandertals formed a clade. Later, nDNA proved Denisovans and Neandertals to be more closely related to one another than to humans (Reich et al., 2010). Then I’m all like, “Hopefully we’ll be able to get human nuclear DNA from Sima de los Huesos. When we do, I predict we’ll see the same kind of twist as with the Denisova DNA, with SH being more similar to Neandertals.”

I made that prediction right before telling Josh Baskin he’d be big.
And lo, Meyer et al. (2016) managed to wring a little bit more DNA out of this sample, and what do they find: “nuclear DNA sequences from two specimens … show that the Sima de los Huesos hominins were related to Neandertals rather than Denisovans” (from the paper abstract).

This is not a surprising outcome. The SH hominins look like Neandertals, and mtDNA acts a single genetic locus – the gene tree is unlikely to reflect the species tree. What’s more, this is similar to the story mtDNA told about human and Neandertal admixture. The lack of Neandertal mtDNA in any living (or fossil) humans was taken to reflect a lack of admixture between early humans and derelict Neandertals, but more recent nDNA analysis have clearly shown that our ancestors couldn’t help but become overcome with lust at the sight of Neandertals (and Denisovans) in Eurasia.
So here ancient DNA corroborates the anatomy that suggested the SH hominins were early members of the Neandertal lineage. This new study also raises the question as to what’s going on with mtDNA lineages – Meyer et al. suggest that the SH mtDNA was characteristic of early Neandertals, later to be replaced by the mtDNA lineage possessed by known Neandertals. They suggest an African origin for this new mtDNA, though I don’t see what that has to be the case. It also raises the question whether the difference in early (SH) vs. later Neandertal mtDNA reflects local population turnover/replacement, or a selective sweep of an adaptive mtDNA variant. Either way, Meyer et al. have done a remarkable job of making astounding discoveries from highly degraded, very short bits of super old DNA. I can’t wait to see what ancient DNA surprises are yet to come.
 References
Bermudez de Castro, JM., Martinón-Torres, M., Lozano, M., Sarmiento, S., & Muela, A. (2004). Paleodemography of the Atapuerca: Sima De Los Huesos Hominin Sample: A Revision and New Approaches to the Paleodemography of the European Middle Pleistocene Population Journal of Anthropological Research, 60 (1), 5-26 DOI: 10.1086/jar.60.1.3631006
Krause, J., Fu, Q., Good, J., Viola, B., Shunkov, M., Derevianko, A., & Pääbo, S. (2010). The complete mitochondrial DNA genome of an unknown hominin from southern Siberia Nature, 464 (7290), 894-897 DOI: 10.1038/nature08976
Meyer, M., Fu, Q., Aximu-Petri, A., Glocke, I., Nickel, B., Arsuaga, J., Martínez, I., Gracia, A., de Castro, J., Carbonell, E., & Pääbo, S. (2013). A mitochondrial genome sequence of a hominin from Sima de los Huesos Nature, 505 (7483), 403-406 DOI: 10.1038/nature12788
Meyer, M., Arsuaga, J., de Filippo, C., Nagel, S., Aximu-Petri, A., Nickel, B., Martínez, I., Gracia, A., de Castro, J., Carbonell, E., Viola, B., Kelso, J., Prüfer, K., & Pääbo, S. (2016). Nuclear DNA sequences from the Middle Pleistocene Sima de los Huesos hominins Nature DOI: 10.1038/nature17405
Reich, D., Green, R., Kircher, M., Krause, J., Patterson, N., Durand, E., Viola, B., Briggs, A., Stenzel, U., Johnson, P., Maricic, T., Good, J., Marques-Bonet, T., Alkan, C., Fu, Q., Mallick, S., Li, H., Meyer, M., Eichler, E., Stoneking, M., Richards, M., Talamo, S., Shunkov, M., Derevianko, A., Hublin, J., Kelso, J., Slatkin, M., & Pääbo, S. (2010). Genetic history of an archaic hominin group from Denisova Cave in Siberia Nature, 468 (7327), 1053-1060 DOI: 10.1038/nature09710