This week I participated in the workshop, “Corpus: The Body in Parts,” organized by Jeremiah Garsha and Jess Beck at University College Dublin (UCD). I joined an interdisciplinary group of researchers from across UCD, as well as keynote speaker Aja Lans (Johns Hopkins University) and artist Liliane Puthod. Our motley crew spent a day discussing different body parts and their intersections across science, society, time, and space. It was fascinating to learn new things about the body and how various parts are viewed in other disciplines, and the discussions have given me a lot to think about for my own research and teaching.
My corporal contribution to the workshop was the brain, so here are some quick notes I put together as I was thinking through what I’d want to talk about that day.
The brain is central to the human experience, which is what Anthropology is all about. Anthropologists generally align with one of four subfields respectively focusing on culture, language, material expression (archaeology), and biological variation. The brain is the part of the body that enables culture, language, and material expression of the lived experience.
A brain is a like a beautifully congealed soup of fats, sugars, protein, water, salt. This remarkable mixture receives information from the outside world, integrates it along with information about our internal states, and then sends signals to the rest of the body about what to do next. In the context of anthropology, this soup of sentience inside the skull provides each individual human with the ability to cooperate with others to solve novel problems.
Human language is a great example of this universal behavioral flexibility. Language writ large encompasses a set of mostly arbitrary symbols (e.g., sounds, gestures) allowing individuals to express infinite ideas to others. There are literally thousands of languages spoken around the planet today, each using different sounds and rules for how these sounds get constructed to convey meaning. Every person is born capable of learning any of these languages— even several of them—as long as they are immersed in a language from a young age. The network of areas in the brain that enable language are pretty much the same in everyone.
So, the brain contributes to cultural and linguistic variation in humans in that it provides the cognitive scaffolding necessary for cultural expression, but the brain certainly doesn’t ‘determine’ cultural differences across the globe. This is important from a historical perspective because in some of the intellectual precursors to modern anthropology, researchers assumed a strong biological determinism underlying human behavioral variation, leading to scientific racism and eugenics which unfortunately have enduring legacies into the present day. Rather, despite the great cultural diversity among humans today, we are remarkably biologically similar to one another the world over.
An enduring question is how (and why) our cultural brains evolved in the first place. Answering this question requires a comparative approach, examining how human brains are similar or different to brains of other animals, as well as how brains vary among members of the same species. One of the coolest things to come out of these comparisons is that there isn’t really anything totally ‘new’ about our brains, except for one surprisingly simple thing. The basic components and structures that are found in the human brain are shared among all animals with a backbone, meaning the basic recipe for brain soup is over 500 million years old. The wrinkly outer rind of the brain—the cerebral cortex—is shared across all mammals, meaning it originated over 200 million years ago. Within mammals, humans are a member of a diverse group called primates, and primate brains have some unique characteristics compared to other furry creatures. We’ve known for over 100 years that human brains are much larger than you’d expect for mammals or even primates of our body size; research in the past 20 years or so has shown that ‘under the hood,’ humans have basically just a primate brain scaled up to a large size.
You might be wondering, if our brains aren’t so different from those of other primates, why are we such weird animals capable of behaviors never seen in the hundreds of millions of years that brains have been around? The answer is that, on the one hand, there are emergent properties that arise simply from increasing brain size, and these properties may allow our brains to do things that other animals’ can’t (as far as we know). On the other hand, close study of other animals is showing that they’re actually a lot smarter than we often give them credit for.
Even though we’re seeing ways that humans are like other animals in both the brain and what the brain can do, we are nevertheless unusual in many ways that underscore the human condition, and we still need an explanation for how/why we evolved. Researchers have made many insights into these questions by comparing us with our closest living relatives: chimpanzees and bonobos. You wouldn’t guess it from looking, but these two apes share a more recent common ancestor with us humans than they do with other apes like gorillas and orangutans. This ancestor probably lived some time between 6–8 million years ago, and presumably its brain would have been lot like that of chimps/bonobos. How did we get from that to the big and powerful processor between our ears?
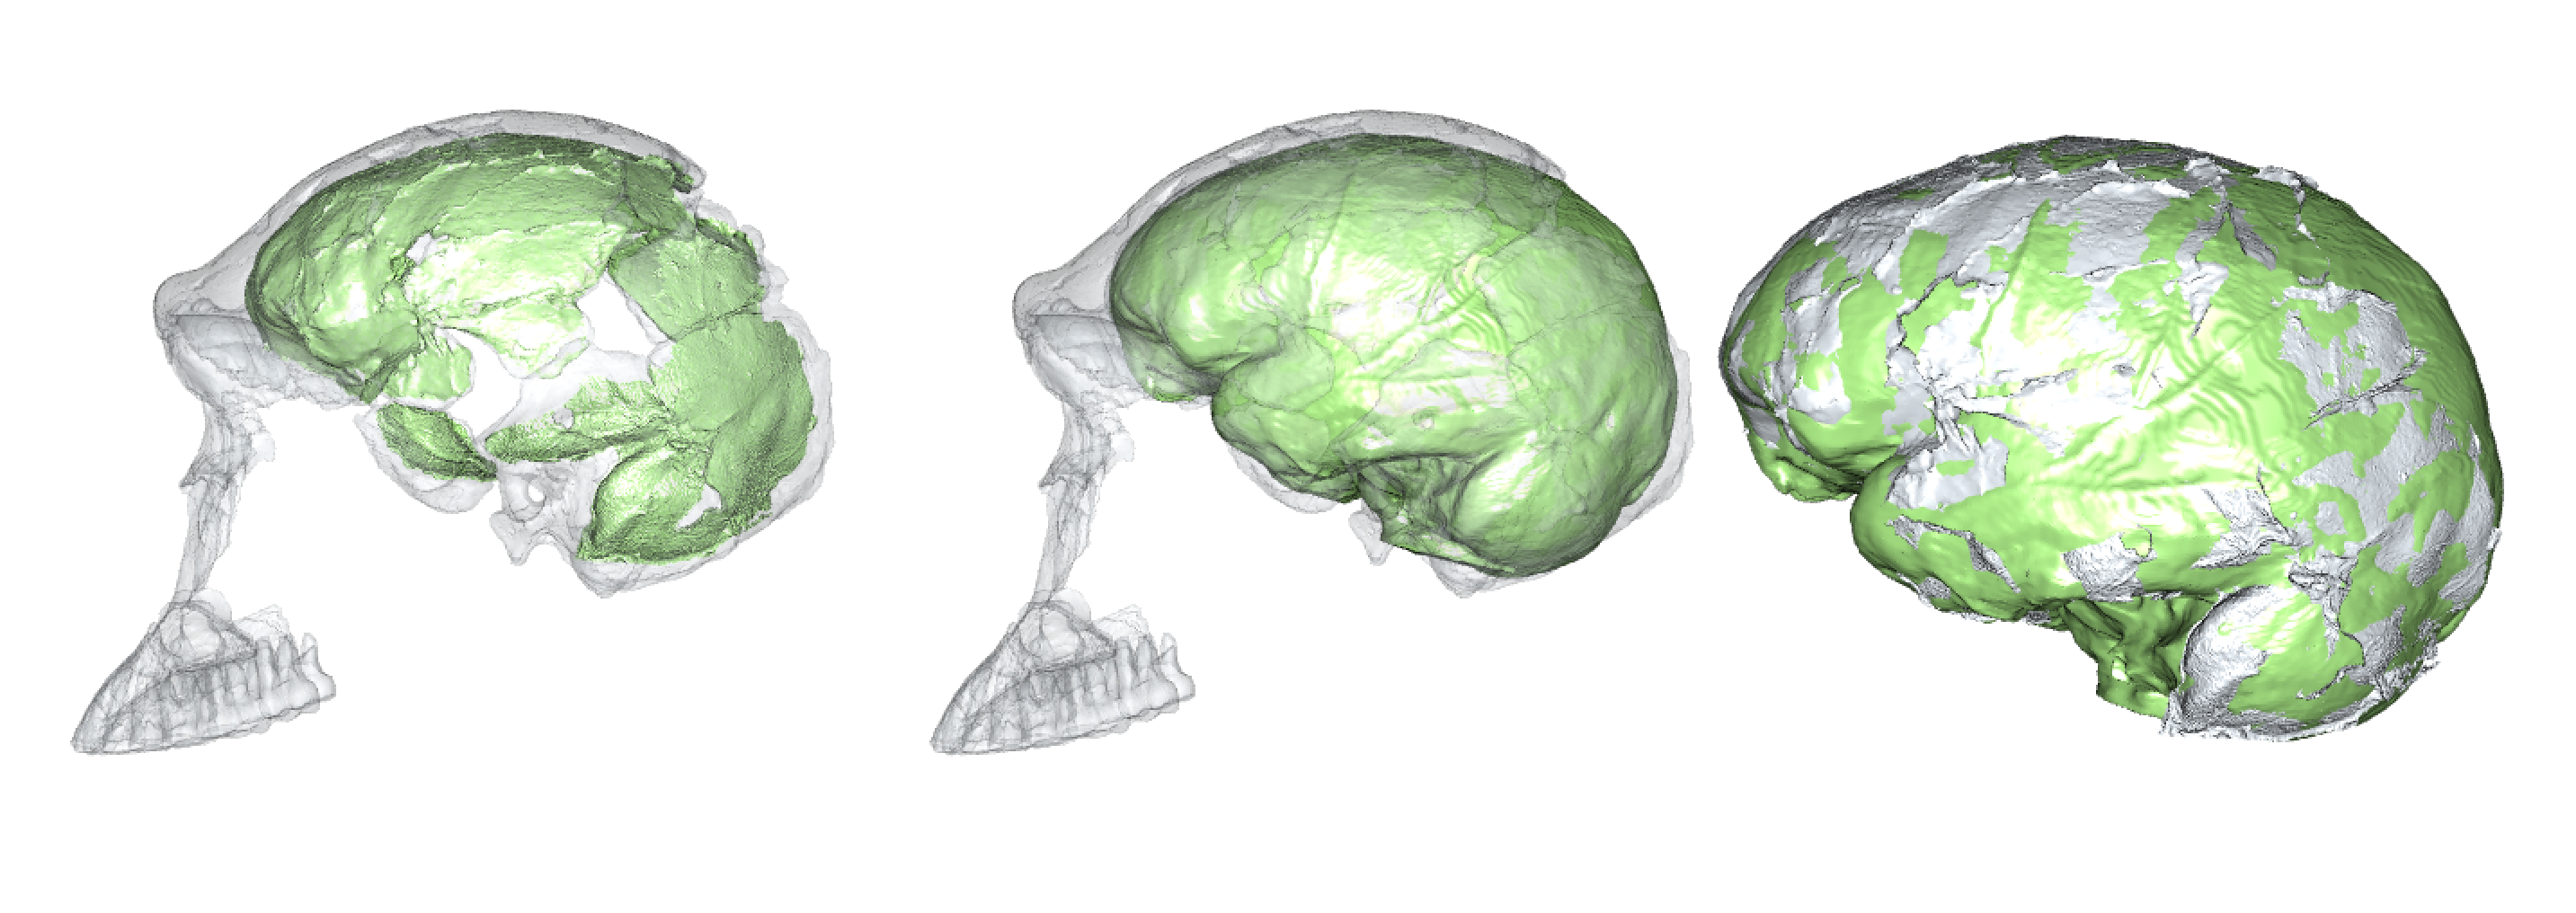
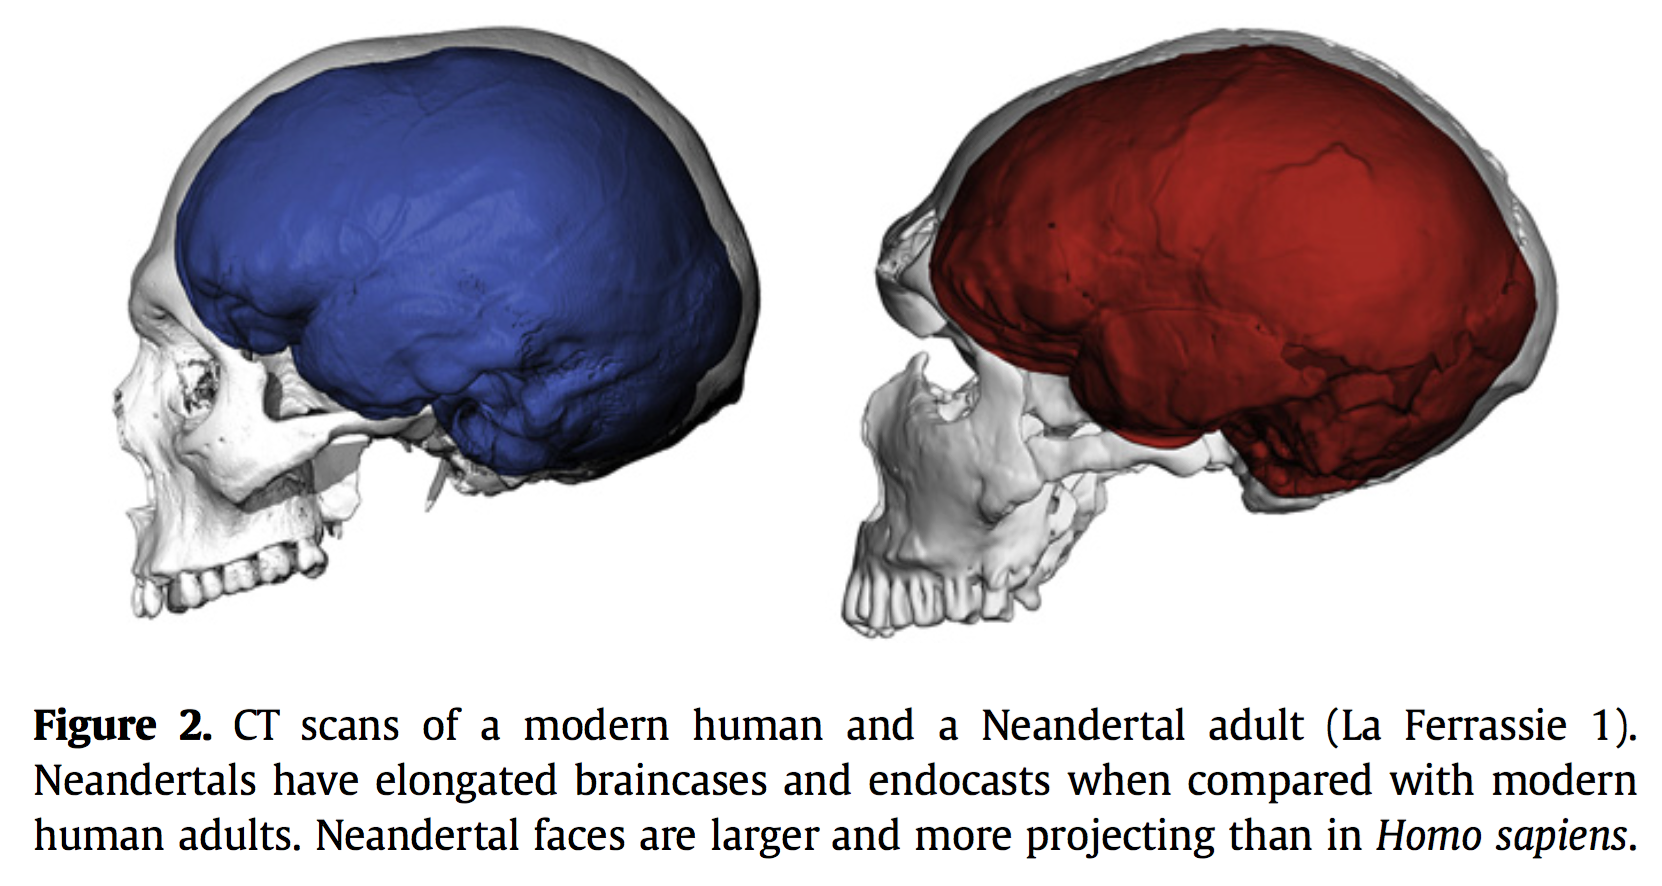
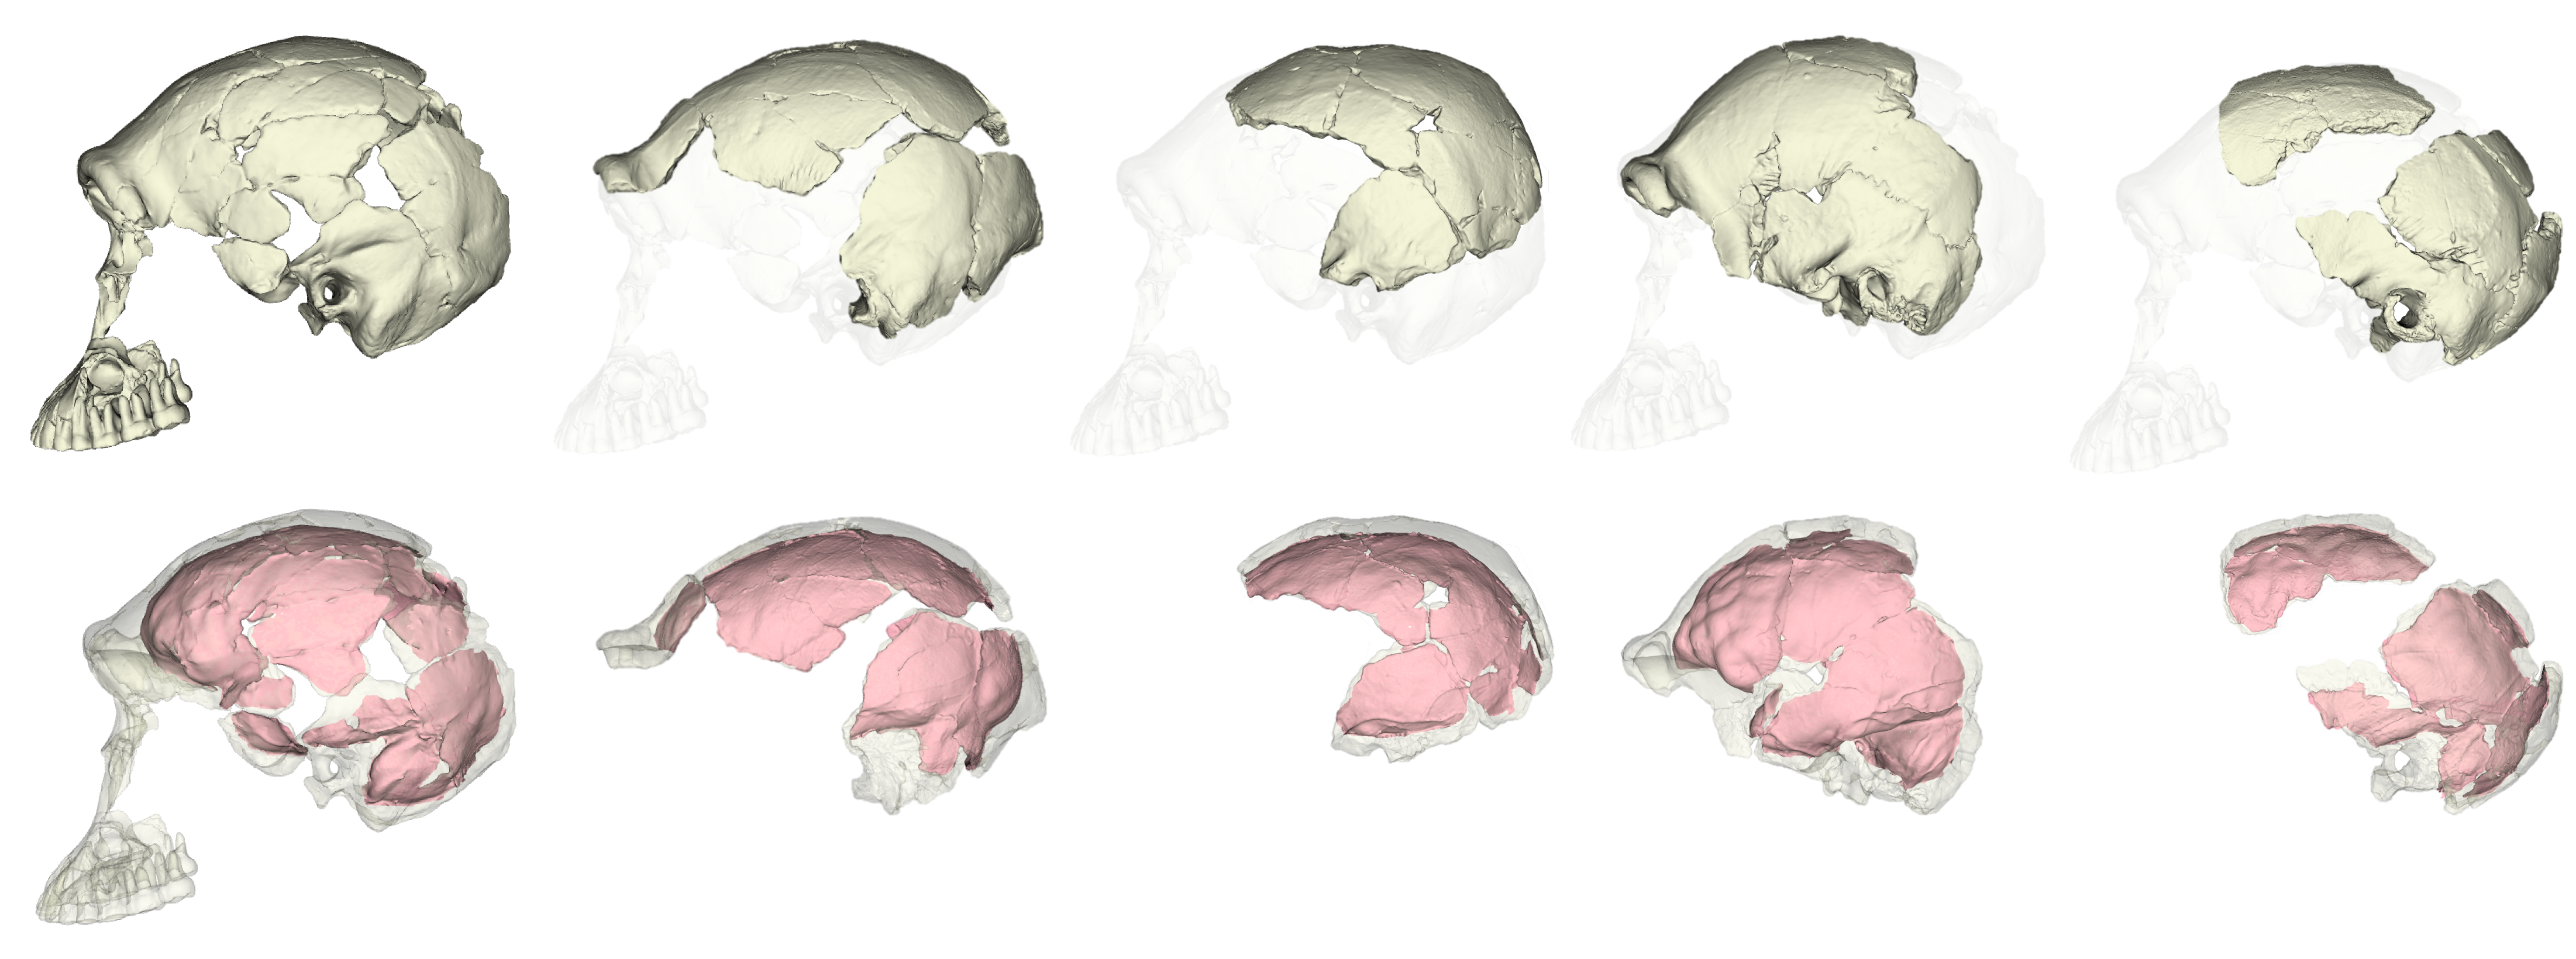
The fossil record provides the only direct evidence (itself rather indirect) of what past brains were like, in the form of endocasts: imprints that the brain makes on the inside of the skull bones during growth. The image I selected for my flash talk (above) shows the endocasts from five fossils of a species called Homo naledi that lived in South Africa around 300,000 years ago. You can see that some are fairly complete (like the one on the left), while others have really prominent impressions created by the outer surface of the brain (like the one second from the right side). All five of these endocasts leave something (or a lot) to be desired. The human fossil record so far provides us with literally hundreds of fossil endocasts at various states of completeness, providing small, blurry windows into brains in the human lineage over the past six million years. Although most are fragmentary, the phantoms of ancient minds, I think they tell a cool story about the human condition, and call for a truly integrative and anthropological approach to studying the brain.
What the fossil evidence seems to show, along with archaeological and modern behavioral research, is that the human brain evolved in order to cooperatively extract and allocate an immense amount of energy from the environment—and a flexibility to do this in almost any environment. Growing a big, human brain requires extensive time and calories; these in turn can only be afforded by cooperative foraging and parenting. So far as we can tell, humans surpass all other animals (or at least primates) in abstract thinking, considering the thoughts and mental states of others, and working with others toward shared goals. The brain as a body part and subject of study is great because we need to draw on diverse types of data and evidence to understand it, an alphabet of disciplines from Anatomy and Anthropology to Physics and Zoology.