The "human" genome?

The topic this week in my Intro to Bioanthro course is genetics, with the subtheme being the mechanisms getting us from a genotype to “the” human phenotype (next week is variation and population genetics). Of course we talked about things like DNA, simple Mendelian inheritance (even though many traits/diseases probably aren’t really Mendelian), and even epigenetics and genomic imprinting. But I also wanted to point out the many ways that our very existence relies on life extrinsic to that encoded by our personal genomes (this was inspired by the intriguingly titled, “A symbiotic view of life: We have never been individuals,” [Gilbert et al., 2012; free pdf]).

Mitochondria are classic examples. These “powerhouses of the cell” or “cellular powerplants” (thanks, Wikipedia!) seem to have once been, at least a billion years ago, their own unicellular organisms that somehow came under the employ of early enterprising eukaryotes. These little organelles are indispensable players in cell metabolism, implicated also in ageing and certain diseases.

In addition, there’s been a lot of research lately on the human ‘microbiome‘ – the specific set of bacteria living in and on our bodies, which aren’t incorporated into our individual cells like mitochondria, but are nevertheless requisite for us to thrive. Analyses of poop, of all things (a scatological lecture is always a good one), have revealed that the bacterial composition of human digestive tracts varies between geographical regions, but also that age-related changes in the microbiome are similar between regions (Yatsunenko et al., 2012; see the review by Ed Yong). These bacteria are crucial to our ability to digest certain foods, and some variation in gut flora probably underlies some diseases (Smith et al., 2013); this is why you may have read about a rise in poop transplants lately (van Nood et al., 2013).

Finally, and I think perhaps most intriguingly, there is evidence that our own genes may be commandeered by the the RNA produced by the things we eat. Now, the regulation of gene expression is bewilderingly complex, and one important player in this are various types of non-coding RNA, including micro RNA (miRNA), piwi-interacting RNA, etc. (I grew up under the paradigm ‘a gene codes for a protein and our genomes contain all this “junk” DNA,’ so RNA-interference and the like blow my mind). Recently, Lin Zhang and colleagues (2012) have found that some miRNA produced by plants can not only survive cooking and digestion, but that these miRNAs can actually interact with, and alter the expression of, at least one human gene (involved in removing bad cholesterol in this case). WHAT?!

ResearchBlogging.orgOne of the most exciting areas of modern biology is the discovery of the various genetic and developmental mechanisms and processes that literally make us human. Of course the genetics of human uniqueness and variation are, to use a phrase I hate, ‘much more complex than previously thought’ (such a pervasive mantra in any field of research…). Not only that, but being human, arguably the most successful complex organism in recent history, is something we cannot even do on our own.

References
Gilbert, S., Sapp, J., & Tauber, A. (2012). A Symbiotic View of Life: We Have Never Been Individuals The Quarterly Review of Biology, 87 (4), 325-341 DOI: 10.1086/668166

Smith MI, Yatsunenko T, Manary MJ, Trehan I, Mkakosya R, Cheng J, Kau AL, Rich SS, Concannon P, Mychaleckyj JC, Liu J, Houpt E, Li JV, Holmes E, Nicholson J, Knights D, Ursell LK, Knight R, & Gordon JI (2013). Gut Microbiomes of Malawian Twin Pairs Discordant for Kwashiorkor. Science PMID: 23363771

van Nood E, Vrieze A, Nieuwdorp M, Fuentes S, Zoetendal EG, de Vos WM, Visser CE, Kuijper EJ, Bartelsman JF, Tijssen JG, Speelman P, Dijkgraaf MG, & Keller JJ (2013). Duodenal infusion of donor feces for recurrent Clostridium difficile. The New England Journal of Medicine, 368 (5), 407-15 PMID: 23323867

Yatsunenko T, Rey FE, Manary MJ, Trehan I, Dominguez-Bello MG, Contreras M, Magris M, Hidalgo G, Baldassano RN, Anokhin AP, Heath AC, Warner B, Reeder J, Kuczynski J, Caporaso JG, Lozupone CA, Lauber C, Clemente JC, Knights D, Knight R, & Gordon JI (2012). Human gut microbiome viewed across age and geography. Nature, 486 (7402), 222-7 PMID: 22699611

Zhang L, Hou D, Chen X, Li D, Zhu L, Zhang Y, Li J, Bian Z, Liang X, Cai X, Yin Y, Wang C, Zhang T, Zhu D, Zhang D, Xu J, Chen Q, Ba Y, Liu J, Wang Q, Chen J, Wang J, Wang M, Zhang Q, Zhang J, Zen K, & Zhang CY (2012). Exogenous plant MIR168a specifically targets mammalian LDLRAP1: evidence of cross-kingdom regulation by microRNA. Cell Research, 22 (1), 107-26 PMID: 21931358

Open wide for open access: chimpanzee tooth eruption

Two anthropology papers came out yesterday in advance print at the Proceedings of the National Academy of Sciences. I’d like first to draw your attention to the fact that they’re open access – normally such scientific papers are behind a paywall, but these two can be obtained by anyone (well, anyone with internet). One is about the chronology and nature of Acheulean technology at the 1.7-1.0 mya site of Konso in Ethiopia. The other, and the subject of this post, is about life history in wild chimpanzees from Uganda.

Tanya Smith and colleagues analyzed behavior of chimps and photographs of chimps’ erupting first molars (“M1”) to determine a] the age at which these events happen in the wild (in this population at least), and b] whether M1 eruption is tightly linked with other important life history variables, such as the adoption of adult foods, as had previously been claimed. What an adorable study – check out figure 1 from the paper (right):

Figuring out age at M1 eruption in wild, healthy chimps is important because there has been debate about whether wild chimps actually erupt their teeth at as young of ages as they do in captivity – not natural conditions. This question has recently been investigated in a skeletal sample of wild chimps of known age, from Tai forest in Cote d’Ivoire (Zihlman et al. 2004, T Smith et al. 2010), but somehow these studies raised more questions than they answered (e.g. BH Smith and Boesch 2011). So TM Smith and colleagues decided to further address this question with photographic evidence of living, arguably healthy chimps.

They found that M1 eruption occurred anywhere from 2.8-3.3 years of age in their sample of 5 cuddly infants, consistent with estimates from captivity. I have to say I’m a bit surprised it wasn’t later (but what fun is science if it’s not surprising?). Of course, this is based on 5 infants from one population, so it could stand to be reinvestigated in other chimp populations as the authors note.

Smith et al’s second task was to see how well age at M1 eruption coincided with other life history variables – this is supposed to be an important event, alleged to coincide with cessation of weaning and the adoption of adult foods. Moreover, since a mother is no longer nursing her infant, M1 eruption “should” also be roughly contemporaneous with a mother’s return to estrus cycling and subsequent reproduction. Many infants were observed to begin eating adult-like foods prior to M1 eruption, around 3 years. Unexpectedly however, infants also nursed for a while even after M1 eruption. In fact, time spent nursing actually increased for a brief period around 3 years of age, possibly because their mothers’ milk was not as nutritious as at younger ages.

Now, what interests me most about this are possible implications for the evolution of growth and life history. Many researchers have argued that extinct hominids, like the australopithecines, would have grown up relatively rapidly like apes, rather than slowly like humans. This claim has been based pretty much entirely on dental development, until my dissertation research. There, I’ve shown that one hominid, Australopithecus robustus, probably experienced greater jaw growth than humans prior to eruption of the M2. Now, if this hominid erupted its teeth as fast as apes, and grew more than humans, this implies really really high growth rates for A. robustus (that is, if we can extrapolate from the jaw to the overall body size).

ResearchBlogging.orgI’ll be working a bit more on this latter point in the near future. In the mean time, let’s hear it for open access bioanthro Continue reading

Introducing a biological anthropology student blog in Kazakhstan

I’m excited to announce a new blog authored by students in my Introduction to Biological Anthropology course here at Nazarbayev University in Astana, Kazakhstan. The goals of this project are manifold, namely: [1] to familiarize students with the blogosphere, and open their eyes to the vast amounts of academic material available – much of it good but lots of it junk – through this and other social media; [2] to help them develop skills in scientific/academic literacy, and more importantly writing and communication; and [3] to show off to the rest of the internet how talented our students are here at NU.

The site is called “Biological Anthropology @ NU.edu.kz,” and can be found at nazarbioanthro.blogspot.com. You can follow the class on Twitter, too (@BioAnthNUeduKZ) to stay up to date on students’ posts. Assuming this pilot semester goes well, I hope to continue the blog and twitter feed for future semesters of this, and other, bio anthro courses at NU.

The first set of posts are going up as we speak: students’ first impressions and expectations for the course, sort of a literary ‘before’ half of a ‘before-and-after’ segment. This semester-long series will culminate in a set of abstracts for mini-grant proposals for research projects that students will devise and write themselves. So stay tuned over the next four months, as these incipient anthropologists post their thoughts, reactions and research on a wide range of topics in this highly interdisciplinary field!

I’m planning on doing a similar blogging project with another course this term, too (Critical Issues in the Humanities and Social Sciences). Details to follow…

A new method for analyzing growth in extinct animals (dissertation summary 1)

The last year and a half was a whirlwind, and so I never got around to blogging about the fruits of my dissertation: Mandibular growth in Australopithecus robustus… Sorry! So this post will be the first installment of my description of the outcome of the project. The A. robustus age-series of jaws allowed me to address three questions: [1] Can we statistically analyze patterns of size change in a fossil hominid; [2] how ancient is the human pattern of subadult growth, a key aspect of our life history;  and [3] how does postnatal growth contribute to anatomical differences between species? This post will look at question [1] and the “zeta test,” new method I devised to answer it.

Over a year ago, and exactly one year ago, I described some of the rational for my dissertation. Basically, in order to address questions [2-3] above, I had to come up with a way to analyze age-related variation in a fossil sample. A dismal fossil record means that fossil samples are small and specimens fragmentary – not ideal for statistical analysis. The A. robustus mandibular series, however, contains a number of individuals across ontogeny – more ideal than other samples. Still, though, some specimens are rather complete while most are fairly fragmentary, meaning it is impossible to make all the same observations (i.e. take the same measurements) on each individual. How can growth be understood in the face of these challenges to sample size and homology?

Because traditional parametric statistics – basically growth curves – are ill-suited for fossil samples, I devised a new technique based on resampling statistics. This method, which I ended up calling the “zeta test,” rephrases the question of growth, from a descriptive to a comparative standpoint: is the amount of age-related size change (growth) in the small fossil sample likely to be found in a larger comparative sample? Because pairs of specimens are likelier to share traits in common than an entire ontogenetic series, the zeta test randomly grabs pairs of differently-aged specimens from one sample, then two similarly aged specimens from the second sample, and compares the 2 samples’ size change based only on the traits those two pairs share (see subsequent posts). Pairwise comparisons maximize the number of subadults that can be compared, and further address the problem of homology. Then you repeat this random selection process a bajillion times, and you’ve got a distribution of test statistics describing how the two samples differ in size change between different ages. Here’s a schematic:

1. Randomly grab a fossil (A) and a human (B) in one dental stage (‘younger’), then a fossil and a human in a different dental stage (‘older’). 2. Using only traits they all share, calculate relative size change in each species (older/younger): the zeta test statistic describes the difference in size change between species. 3. Calculate as many zetas as you can, creating a distribution giving an idea of how similar/different species’ growth is.

The zeta statistic is the absolute difference between two ratios – so positive values mean species A  grew more than species B, while negative values mean the opposite. If 0 (zero, no difference) is within the great majority of resampled statistics, you cannot reject the hypothesis that the two species follow the same pattern of growth. During each resampling, the procedure records the identity and age of each specimen, as well as the number of traits they share in common. This allows patterns of similarity and difference to be explored in more detail. It also makes the program run for a very long time. I wrote the program for the zeta test in the statistical computing language, R, and the codes are freely available. (actually these are from April, and at my University of Michigan website; until we get the Nazarbayev University webpage up and running, you can email me for the updated codes)

The zeta test itself is new, but it’s based on/influenced by other techniques: using resampling to compare samples with missing data was inspired by Gordon et al. (2008). The calculation of ‘growth’ in one sample, and the comparison between samples, is very similar to as Euclidean Distance Matrix Analysis (EDMA), devised in the 1990s by Subhash Lele and Joan Richtsmeier (e.g. Richtsmeier and Lele, 1993). But since this was a new method, I was glad to be able to show that it works!

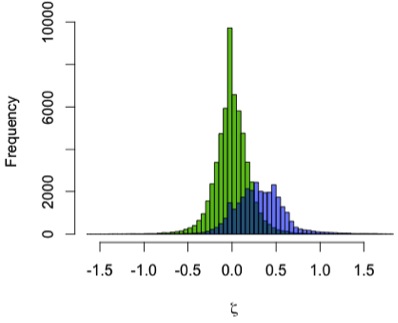
I used the zeta test to compare mandibular growth in a sample of 13 A. robustus and 122 recent humans. I first showed that the method behaves as expected by using it to compare the human sample with itself, resampling 2 pairs of humans rather than a pair of humans and a pair of A. robustus. The green distribution in the graph to the left shows zeta statistics for all possible pairwise comparisons of humans. Just as expected, that it’s strongly centered at zero: only one pattern of growth should be detected in a single sample. (Note, however, the range of variation in the green zetas, the result of individual variation in a cross-sectional sample)

In blue, the human-A. robustus statistics show a markedly different distribution. They are shifted to the right – positive values – indicating that for a given comparison between pairs of specimens, A. robustus increases size more than humans do on average.

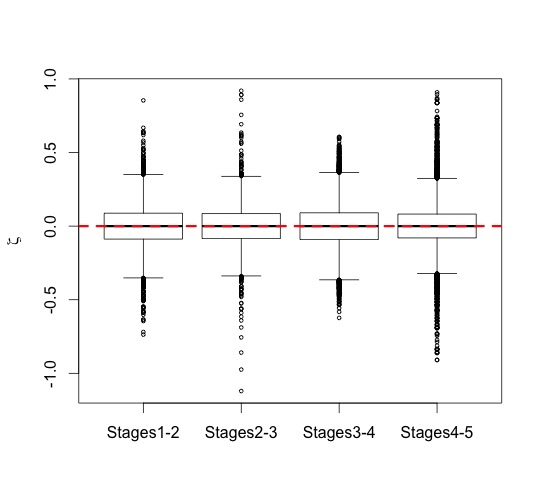
We can also examine how zeta statistics are distributed between different age groups (above). I had broken my sample into five age groups based on stage of dental eruption – the plots above show the distribution of zeta statistics between subsequent eruption stages, the human-only comparison on the left and the human-A. robustus comparison on the right. As expected, the human-only statistics center around zero (red dashed line) across ontogeny, while the human-A. robustus statistics deviate from zero markedly between dental stages 1-2 and 3-4. I’ll explain the significance of this in the next post. What’s important here is that the zeta test seems to be working – it fails to detect a difference when there isn’t one (human-only comparisons). Even better, it detects a difference between humans and A. robustus, which makes sense when you look at the fossils, but had never been demonstrated before.

So there you go, a new statistical method for assessing fossil samples. The next two installments will discuss the results of the zeta test for overall size (important for life history), and for individual traits (measurements; important for evolutionary developmental biology). Stay tuned!

ResearchBlogging.org Several years ago, when I first became interested in growth and development, I changed this blog’s header to show this species’ subadults jaws – it was only last year that I realized this would become the focus of my graduate career.

References
Gordon AD, Green DJ, & Richmond BG (2008). Strong postcranial size dimorphism in Australopithecus afarensis: results from two new resampling methods for multivariate data sets with missing data. American journal of physical anthropology, 135 (3), 311-28 PMID: 18044693

Richtsmeier JT, & Lele S (1993). A coordinate-free approach to the analysis of growth patterns: models and theoretical considerations. Biological Reviews, 68 (3), 381-411 PMID: 8347767

Osteology everywhere: Muffin tops

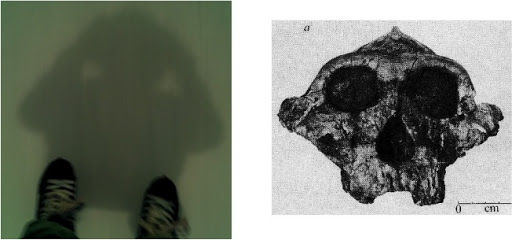
It’s become challengingly chilly here in Astana and my days of running outdoors are fading into memories redshifting into oblivion, so last weekend I went ice skating instead. Pulling off certifiably Scott Hamiltonian moves, I espy my silhouette and what hominid face is staring back?

That’s, right, Australopithecus boisei (right). Of course they’re not identical, but then they don’t really have to be when you see Osteology Everywhere.

But then again, when you’ve been doing this too long, you start to see Paleontology Everywhere, too. The shadow also reminded me of a time a few years ago, when we were picking through bags of backdirt at Dmanisi, foraging for micromammals, passing pachmelia and time with trivia. Someone posed the riddle, “What did one muffin say to the other muffin?” To which I responded:

Osteology Everywhere: Zubi

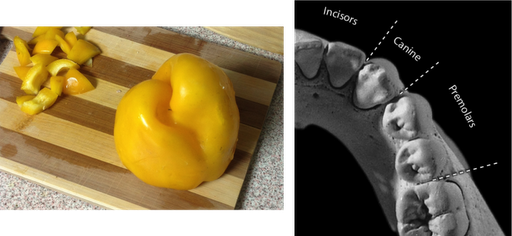
We’re going over bone biology and bioarchaeology this week in my Intro to Bio class, and so I thought I’d open the unit with my patent-pending Osteology Everywhere series. I showed the students the various real-life objects from the series, and they kicked buttocks at seeing the bones in quotidian things. They even got this new one:

That yellow pepper is a ringer for a premolar crown, which hopefully was not as yellow. So I’m very proud of my students. I figure if I can make people see bones everywhere they look, well then I’ve done my job. But hopefully they don’t get as bad as me: a few months ago my friend bought one of those Kinder chocolate eggs with a prize inside. Shaking it, you could hear something rattling in there. It’s disconcerting that my mind immediately guessed, “Legos, or teeth.” At least legos came before teeth.

Also “zubi,” from the title, is the Croatian word for ‘teeth’ (and apparently also slang for ‘breasts’).

The beardless White House: Part I

Something’s been bothering me about this election. No, it’s not the silence from both major parties on climate change. It’s the fact that neither Obama nor Romney (I accidentally just typed “RMoney”… accidentally?) sports facial hair. A friend and I were talking about this the other day, and a quick google search showed us there hasn’t been an appreciable furface sleeping at 1600 Pennsylvania Ave. since the mustachioed WH Taft (of butter and bathtub fame), 100 years ago. That is, unless any of these recent presidents was a closet homosexual (different meaning of “beard”).

This is hairy dearth is deplorable. Just look at this pic of portraits of past presidents:

You’re probably thinking, “Where’s all the virile scruff?” Well, no, you’re probably thinking, “There’s a lot of dudes / white ppl there.” But your next thought is probably, “Where’s all the virile scruff?” However, from Abe Lincoln through Bill Taft there’s a fairly flagrant concentration of beards, mustaches and whatever you call the thing hiding Chester A. Arthur’s charming smile (squared off in red); only W McKinley and A Johnson dared rain on this badass parade. Yes, there are some audacious sideburns on John Q. Adams and Martin Van Buren, but otherwise all Executive facial hair is concentrated between 1860 and 1913. What gives?

It looks like there’s a fairly clear pattern: voters loathed and distrusted facial hair for the first nearly 100 years of American history, followed by a brief period in which facial hair was loved and trusted, which may then have been ruined by Taft and after which there’s been nary a stache nor goat sitting in the oval office to the present day. Is this a real pattern, or could some other random process produce this same distribution of scruff? (for simplicity’s sake, we’ll pretend no president served more than 1 term…) Could random sampling of 43 (mostly white) men give us a clump of 9/13 with facial hair? (side burns don’t count) If there’s a 50/50 chance of a man growing facial hair, is 9/43 Prezes unusually high or low? I’ll let you know after I write and run some tests!

microRNAs punch Plasmodium parasites in the face

This is the first time I’m teaching Introduction to Biological Anthropology here at Nazarbayev University. It’s exciting and curious that for nearly every class session, I’m able to find a very recent outside article or blog post that’s relevant to the field and/or something we’re talking about at the moment. For instance, the 30-paper barrage of the ENCODE project came out right as we were beginning the unit focused on evolution and genetics. Serendipity!

Recently in this first unit, we covered one of the classic anthro examples illustrating principles of both genetics and evolution: sickle-cell anemia and malaria resistance. And right on cue, a brief review about the actual molecular basis for this phenomenon was just published in Nature Genetics (Feliciano, 2012, reviewing LaMonte et al., 2012).

Briefly, sickle-cell anemia is an iron deficiency caused by having aberrant hemoglobin, and characterized by sickle-shaped red blood cells (“erythrocytes”). The sickle cell trait is caused by a simple point mutation on the 11th chromosome, at a locus termed the hemoglobin S (or HbS) allele; the ‘normal’ allele is designated A (or HbA). If you have two A alleles you have normal hemoglobin, whereas two S alleles result in sickle cell, which is generally fatal. You don’t want to have two S alleles. The deleterious S allele is nevertheless maintained in the population because heterozygous individuals (AS genotype) have basically normal red blood cells and resistance to malaria, a disease caused by the parasite Plasmodium falciparum. P. falciparum loves red blood cells, and so in populations where malaria is endemic, having normal hemoglobin can actually be a health risk because of stupid smelly P. falciparum. Natural selection therefore maintains both the normal A and sickle S alleles in malarial areas because of a heterozygote advantage.

The outstanding question, however, is how having both an A and an S allele confers resistance to malaria. The textbook explanation (e.g. Larsen, 2010) is that sickle cells are poor in oxygen, and therefore poor hosts for stupid smelly P. falciparum. A recent study, however, points to a much more badass mechanism of resistance.

LaMonte and colleagues (2012) show a role for microRNAs (miRNA) in sickle cell-mediated resistance to malaria. miRNAs are small strands of RNA (21-25 base pairs long) that do not get translated into proteins, but are nevertheless important in regulating gene expression. This mechanism is called RNA interference (RNAi) – check out this sweet slideshow and animation from Nature for more info. What LaMonte and colleagues found was that SS and AS red blood cells had higher concentrations of certain variants of miRNA, which were then transferred into P. falciparum parasitizing these cells. These miRNA-enriched parasites, in turn, showed reduced growth compared to those parasitizing normal cells. It remains to be seen, however, just how these human miRNAs are disrupting development of Plasmodium, since these parasites do not produce the same genetic machinery that utilizes the miRNA used in human RNAi (Feliciano, 2012).

ResearchBlogging.orgNot being a geneticist, I’m really enjoying how complicated the genome is proving to be. The example here illustrates not only our increased appreciation for RNA and especially non-protein-coding elements, but also the dynamic genetic interactions between different species.

Better explanations than I was able to give
Feliciano P (2012). miRNAs and malaria resistance. Nature genetics, 44 (10) PMID: 23011225

Lamonte G, Philip N, Reardon J, Lacsina JR, Majoros W, Chapman L, Thornburg CD, Telen MJ, Ohler U, Nicchitta CV, Haystead T, & Chi JT (2012). Translocation of Sickle Cell Erythrocyte MicroRNAs into Plasmodium falciparum Inhibits Parasite Translation and Contributes to Malaria Resistance. Cell host & microbe, 12 (2), 187-99 PMID: 22901539

Bonobo survival strategy

A paper was just released that showcases the technological prowess of two captive bonobos (Pan paniscus), the famous Kanzi and the less famous Pan-Banisha (Roffman & al. in press). It’s a neat paper, and I don’t really have much to say about it, but I will pass on what I enjoyed most about it (abstract and keywords):

It sounds like a rock band or something. You don’t see key words/phrases like that every day!

ResearchBlogging.org
Read for yourself
Itai Roffman, Sue Savage-Rumbaugh, Elizabeth Rubert-Pugh, Avraham Ronen, & Eviatar Nevo (2012). Stone tool production and utilization by bonobo-chimpanzees (Pan paniscus) Proceedings of the National Academy of Sciences, in press DOI: 10.1073/pnas.1212855109